Eni stock forecast: 2026–2029 strategy update
Eni S.p.A. is an Italian energy group listed in Milan, with its shares in focus on 19 March 2026 as the company presents its 2026–2029 strategic plan after stronger Q4 2025 results. Past performance is not a reliable indicator of future results. Explore third-party ENI price targets.
Eni S.p.A. (ENI) is trading at €23.64 as of 1:59pm UTC on 19 March 2026, near the top of its €22.93–€23.72 intraday range. Past performance is not a reliable indicator of future results.
The session's gains come as Brent crude extended its recent surge, rising to around $111.35 per barrel on 19 March 2026 – up roughly 55% over the prior month – amid sustained geopolitical tensions affecting Middle East supply routes and elevated uncertainty in European energy markets (Trading Economics, 19 March 2026). Bloomberg also reported that the STOXX Europe 600 energy sector had risen for eight consecutive sessions to a fresh record as of 17 March 2026, reinforcing the broader backdrop (Bloomberg, 17 March 2026).
Eni's own strategic calendar adds a company-specific catalyst today, with the firm's 2026 Capital Markets Update conference call scheduled for 2pm CET on 19 March 2026, at which management is presenting its 2026–2029 strategic plan (Eni, 19 March 2026). This follows Eni's Q4 2025 results in February, when adjusted net profit rose 35% year on year to €1.2 billion, beating analyst consensus of €960 million, on hydrocarbon production of 1.84 million barrels of oil equivalent per day (Reuters, 26 February 2026).
Eni stock forecast 2026–2030: Third-party price targets
The following is a summary of third-party Eni stock predictions based on the sources referenced below. As of 19 March 2026, third-party Eni stock predictions have been revised sharply higher through mid-March 2026, driven by Brent crude's sustained rally above $100 per barrel and Eni's strong Q4 2025 earnings beat.
Berenberg (Hold, target raised)
Berenberg analyst Henry Tarr raised the 12-month ENI stock forecast to €17.50 from €14.50, retaining a Hold rating. The bank expects higher earnings from elevated commodity prices while maintaining its cautious stance, given that the stock had rallied more than 50% in the preceding 12 months (The Globe and Mail, 12 March 2026).
Goldman Sachs (Buy, target revised upward)
Goldman Sachs analyst Michele della Vigna raised the price target on Eni to €21 from €19, maintaining a Buy rating. The revision reflects the bank's view that volume growth and disciplined capital expenditure support cash generation at prevailing Brent levels, following Eni's Q4 2025 results beat (MarketScreener, 9 March 2026).
MarketBeat (consensus summary)
MarketBeat reports that 12 analysts covering Eni's NYSE-listed shares assigned a consensus Moderate Buy rating, with an average 12-month price target of $34.60. The consensus incorporates one Strong Buy, four Buy, and seven Hold ratings, reflecting a broadly constructive but differentiated view across the covering broker panel (MarketBeat, 16 March 2026).
Bank of America (Hold, rating maintained)
Bank of America reaffirmed a Hold rating on Eni, declining to raise its stance despite the stock's sharp year-to-date move. The bank's maintained rating reflects its view that current valuations already price in much of the commodity tailwind and near-term upstream delivery (The Globe and Mail, 15 March 2026).
Barclays (Buy, target raised)
Barclays analyst Lydia Rainforth revised the price target on Eni to €22.50 from €27, while retaining a Buy rating. The action follows Eni's announcement of gas delivery from the Quiluma field offshore Angola and a fresh gas discovery offshore Libya of more than 1 trillion cubic feet, reinforcing the bank's positive view on the company's upstream exploration pipeline (MarketScreener, 17 March 2026).
Predictions and third-party forecasts are inherently uncertain, as they cannot fully account for unexpected market developments. Past performance is not a reliable indicator of future results.
ENI stock price: Technical overview
On the daily chart, the ENI stock price trades at €23.64, sitting near the top of its €22.93–€23.72 intraday range and well clear of its 20-, 50-, 100-, and 200-day SMAs at around €21, €19, €17, and €16 respectively. According to TradingView data, all 12 moving averages in the panel carry a buy signal, with the 20-over-50 alignment firmly intact, which keeps the broader trend constructive. The Hull moving average (9) at €23.71 is the lone sell-flagged exception, a reminder that the short-term extension is running close to its own ceiling.
Momentum is stretched: the 14-day RSI stands at 86.2, deep in overbought territory, while the average directional index (14) at 64.8 confirms a well-established trending move rather than a ranging one. The ultimate oscillator (28-period composite) reads 80.0 and also flags a buy, in line with TradingView’s signal set, though the commodity channel index (20) at 147.6 registers a sell signal, suggesting that price has extended sharply beyond its historical average.
The nearest classic pivot resistance on the topside is R1 at €20.77, already far below the current price, meaning the stock has cleared its near-term pivot structure entirely. R2 at €21.88 and R3 at €25.02 now provide the next reference levels, with R3 the closest ceiling of note above. A sustained daily close toward €25.02 could mark a test of that upper pivot band, while the round €24 figure may serve as an intermediate psychological reference.
On pullbacks, the classic pivot (P) at €18.74 offers the first meaningful reversion anchor, with the 100-day SMA near €17.35 acting as the next structural shelf below. If the price closes below the €18.74 pivot level on a daily basis, it could open the way for a deeper move toward S1 at €17.63, which converges closely with that 100-day SMA support zone (TradingView, 19 March 2026).
This is technical analysis for informational purposes only and does not constitute financial advice or a recommendation to buy or sell any instrument.
Eni share price history (2024–2026)
ENI’s stock price has undergone a significant transformation over the past two years, climbing from the mid-€14s in March 2024 to trade near multi-year highs above €23 in March 2026.
The stock opened March 2024 around €14.35 and remained broadly rangebound through most of that year, oscillating in a tight €13.57–€15.74 corridor. A peak of €15.74 on 12 April 2024 gave way to a gradual drift lower through the summer, with ENI touching €13.73 on 30 September 2024 before steadying into year-end. The stock closed 2024 at €13.10 on 30 December.
2025 began quietly, with ENI trading in a narrow €13.42–€14.11 band through the first quarter. A sharper leg lower followed in April, as the stock slid to a two-year trough of €11.28 on 9 April 2025 amid broad energy sector weakness. Recovery was gradual but consistent: ENI clawed back toward €13 by late May and consolidated in the €14–€15 range through autumn.
The breakout came in early 2026. ENI ended 2025 at €16.18 and accelerated sharply through February and March, rising from €17.26 at the start of February to close at €23.71 on 19 March 2026 – about 46.5% year to date and 65.5% higher than a year earlier.
Past performance is not a reliable indicator of future results. Share prices are indicative and may differ from live market prices.
Eni (ENI): Capital.com analyst view
Eni's price performance over the past 12 months has been striking, with the stock recovering from its April 2025 trough near €11.28 to trade above €23 by mid-March 2026, a move driven largely by Brent crude's sustained rally and Q4 2025 earnings that came in above Q3 2025 levels, according to reported company results. The company's upstream production growth, disciplined capital expenditure, and active portfolio management through asset sales have reinforced the case put forward by analysts and market participants monitoring the European energy sector. That said, Eni's close correlation with commodity prices cuts both ways: a reversal in crude, whether through demand weakness, OPEC supply increases, or a global growth slowdown, could unwind gains as quickly as they accumulated.
The broader geopolitical backdrop and Europe's ongoing energy security concerns have added a structural dimension to near-term sentiment, though regulatory pressure on fossil fuel producers and the pace of the energy transition remain material headwinds that could weigh on longer-term valuations. Analyst opinion is divided, ranging from Hold to Buy, reflecting genuine uncertainty about how much of the commodity tailwind is already priced in at current levels.
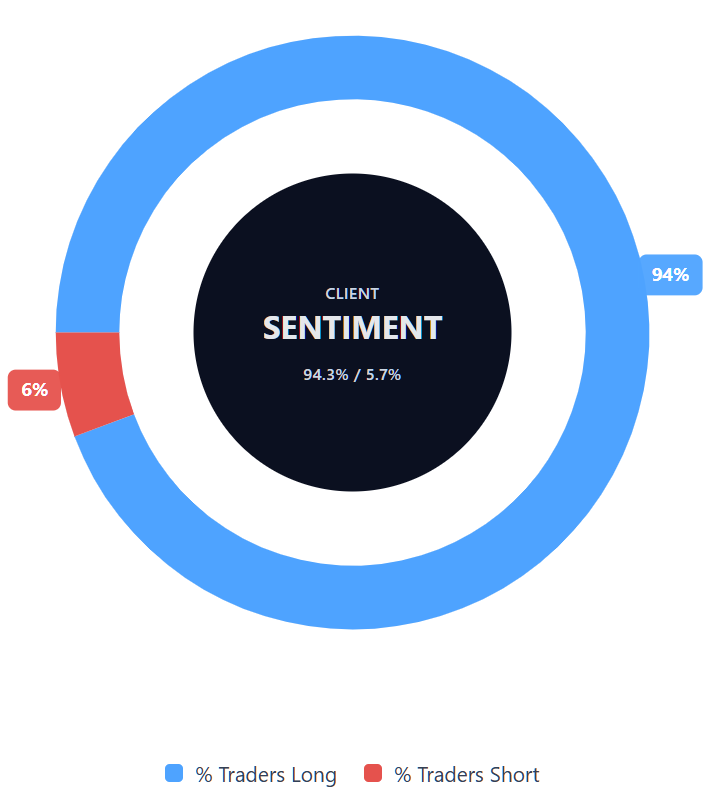
Capital.com’s client sentiment for Eni CFDs
As of 19 March 2026, Capital.com client positioning in Eni CFDs is skewed toward longs: 94.3% buyers compared with 5.7% sellers, putting buyers ahead by 88.6 percentage points and placing sentiment firmly in one-sided, heavy-buy territory. This snapshot reflects open positions on Capital.com and can change rapidly as market conditions evolve.
Summary – Eni 2026
- ENI trades at €23.64 as of 1:59pm UTC on 19 March 2026, up roughly 65.5% year on year and 46.5% year to date.
- The primary price driver is Brent crude's sharp rally, with the commodity rising above $111 per barrel and lifting European energy stocks more broadly.
- Eni's Q4 2025 adjusted net profit rose 35% year on year to €1.2bn, beating consensus, supported by hydrocarbon production of 1.84 million barrels of oil equivalent per day.
- Eni's 2026 Capital Markets Update, presented on 19 March 2026, outlines the company's 2026–2029 strategic plan, adding a company-specific catalyst to the session.
Past performance is not a reliable indicator of future results.
FAQ
Who owns the most Eni S.p.A. stock?
What is the 5 year Eni S.p.A. share price forecast?
Is Eni S.p.A. a good stock to buy?
Could Eni S.p.A. stock go up or down?
Should I invest in Eni S.p.A. stock?
Can I trade Eni S.p.A. CFDs on Capital.com?
Yes, you can trade Eni CFDs on Capital.com. Trading share CFDs lets you speculate on price movements without owning the underlying asset and to take long or short positions. However, contracts for difference (CFDs) are traded on margin, and leverage amplifies both profits and losses. You should ensure you understand how CFD trading works, assess your risk tolerance, and recognise that losses can occur quickly.