Cardano price prediction: USDCx launch, Protocol 11
Cardano (ADA) trades near $0.26 as US CPI and a March Fed meeting shape crypto sentiment, while Cardano rolls out USDCx and prepares Protocol 11 and Midnight. Past performance is not a reliable indicator of future results. Explore third-party ADA price targets and technical analysis.
Cardano (ADA/USD) is trading at $0.26271 as of 3:25pm UTC on 11 March 2026, within an intraday range of $0.25521-$0.27246. Past performance is not a reliable indicator of future results.
ADA’s price action reflects a confluence of macro and ecosystem-specific pressures. The broader cryptocurrency market edged lower on 11 March 2026, with Bitcoin trading near $70,381 and total crypto market capitalisation declining by about 1.0% over the prior 24 hours (CoinCodex, 11 March 2026). The move followed the release of the US Bureau of Labor Statistics’ February CPI report, which showed the all-items index up 2.4% year on year, unchanged from January, and the core rate steady at 2.5% year on year (Bureau of Labor Statistics, 11 March 2026), ahead of the Federal Reserve’s scheduled policy decision on 18 March 2026 (CME Group, 11 March 2026).
Within the Cardano ecosystem, network activity has been shaped by the launch of the USDCx stablecoin collateralised by Circle’s USDC reserves in late February (Input Output, 27 February 2026), alongside the scheduled Protocol 11 hard fork (Cardano, 4 December 2026) and Midnight privacy sidechain mainnet deployment during March (Bankless Times, 3 March 2026). Cross-chain inflows via Wanchain reportedly exceeded $80m in net capital transfers to the network (Cyprus Mail, 6 March 2026).
Cardano price prediction 2026-2030: Analyst price target view
As of 11 March 2026, third-party ADA price predictions span a wide spectrum, shaped by divergent assumptions around network upgrade delivery, macro conditions, and the potential for institutional inflows via a spot ETF. The following targets summarise leading model-based and research-driven projections for the Cardano market.
Changelly (monthly model, near-term range)
Changelly places ADA’s March 2026 trading range at $0.259-$0.337, with an average for the month near $0.298, just above current levels. The model extends its outlook to April 2026, where the average shifts to $0.324, citing an expected improvement in broader crypto market conditions as the primary driver (Changelly, 10 March 2026).
CoinCodex (algorithmic year-end model)
CoinCodex reports that near-term forecasting models cluster ADA in a $0.26-$0.30 range as of March 2026, with resistance at $0.30 and support near $0.26, while noting some price models extend to $0.80-$1 by late 2026 in more optimistic scenarios. The analysis cites the potential SEC approval of a standalone Grayscale Cardano Trust ETF, currently under review, as a catalyst that could expand institutional access and liquidity, with ADA already represented inside Grayscale’s approved Digital Large Cap ETF (CoinCodex, 3 March 2026).
Coinpedia (scenario-based annual forecast)
Coinpedia presents a base-case range of $2.75-$3.25 for ADA’s full-year 2026 average, with an average price of $3, in a scenario that assumes more supportive market sentiment, ETF-related institutional inflows, and sustained network growth. A more conservative scenario without ETF approval narrows the range to $0.85-$1.25, while a bullish breakout case with ETF approval and macro support lifts the potential high to $2.80 (Coinpedia, 22 February 2026).
Predictions and third-party forecasts are inherently uncertain, as they cannot fully account for unexpected market developments. Past performance is not a reliable indicator of future results.
ADA price: Technical overview
The ADA/USD price trades at $0.26271 as of 3:25pm UTC on 11 March 2026, sitting just above its 10-day SMA at $0.2628 and inside a broad descending moving-average stack. The 20/50/100/200-day SMAs run at $0.2701 / $0.2888 / $0.3402 / $0.5174, all above the current price. Some technical frameworks interpret this configuration as consistent with a broader downtrend across multiple timeframes.
The 14-day RSI reads 45.26, placing it in neutral territory with no immediate momentum confirmation in either direction. The average directional index (14) sits at 17.09, below the 25 threshold, signalling a weak and directionless trend environment at present.
To the topside, the classic R1 pivot at $0.3230 is the first meaningful reference; a convincing daily close above that level would put the R2 area near $0.3650 in view. The round $0.29 figure, in the vicinity of the 50-day SMA at $0.2888, acts as an intervening layer of resistance before R1.
On pullbacks, the classic pivot at $0.2717 provides initial support; a slip beneath that level would expose the S1 zone near $0.2297. Losing $0.2297 on a sustained basis would bring the S2 area at $0.1784 into consideration as the next meaningful reference to the downside (TradingView, 11 March 2026).
This is technical analysis for informational purposes only and does not constitute financial advice or a recommendation to buy or sell any instrument.
Cardano price history (2024–2026)
ADA/USD started March 2024 trading around $0.45, then climbed steadily through spring, reaching roughly $0.65 by the end of March and holding near $0.46 through May and June. The second half of 2024 brought a sharp recovery, with ADA pushing past $1 in early December and touching an intraday high of $1.33 on 3 December 2024, its strongest level in the two-year window covered here.
The momentum carried into early 2025, with ADA briefly touching $1.14 in early March 2025 before a swift reversal. From that peak, the token sold off sharply, sliding back below $0.65 by the end of March 2025 and continuing to drift lower. A second recovery emerged through mid-2025, with ADA recovering to around $0.69 in September and climbing to a local high near $0.93 in late October, before pulling back toward $0.33 in late November 2025.
The year closed at $0.33 on 31 December 2025 and opened 2026 at $0.36 on 1 January. ADA pushed toward $0.43 in early January 2026 before beginning a steady decline, and by 11 March 2026 the token trades at $0.26271 – down approximately 21.2% year to date and approximately 63.8% below its 3 December 2024 high of $1.33.
Past performance is not a reliable indicator of future results. Share prices are indicative and may differ from live market prices.
Capital.com analyst view: Cardano
Cardano’s price performance so far in 2026 reflects the tension between ongoing network development and a broader crypto market environment that has remained cautious. ADA entered the year around $0.36 and climbed to a local high near $0.43 in early January, before a prolonged decline brought it to $0.26271 as of 11 March 2026.
The network’s March 2026 upgrade schedule, which includes the Protocol Version 11 hard fork, the Midnight privacy sidechain mainnet launch, and the USDCx stablecoin integration, could affect the ecosystem’s DeFi capacity and how participants assess institutional accessibility. However, Cardano’s total value locked had declined to around $219m by early 2026 against a backdrop of intensifying competition from rival layer-1 blockchains, and the question of whether upgrade delivery alone translates into sustained price appreciation remains open.
On the macro side, Grayscale’s decision to raise ADA’s weighting to 20.07% in its Smart Contract Platform Fund signals some institutional interest, and cross-chain inflows exceeding $80m via LayerZero reflect expanding liquidity access. At the same time, broader uncertainty around US trade policy and a risk-off tone across crypto markets have weighed on sentiment, and ADA’s 14-day RSI sitting in neutral territory near 45 suggests the market has yet to show clear directional conviction. Whether the March upgrade catalysts shift that dynamic depends in part on execution quality and the pace of adoption that follows.
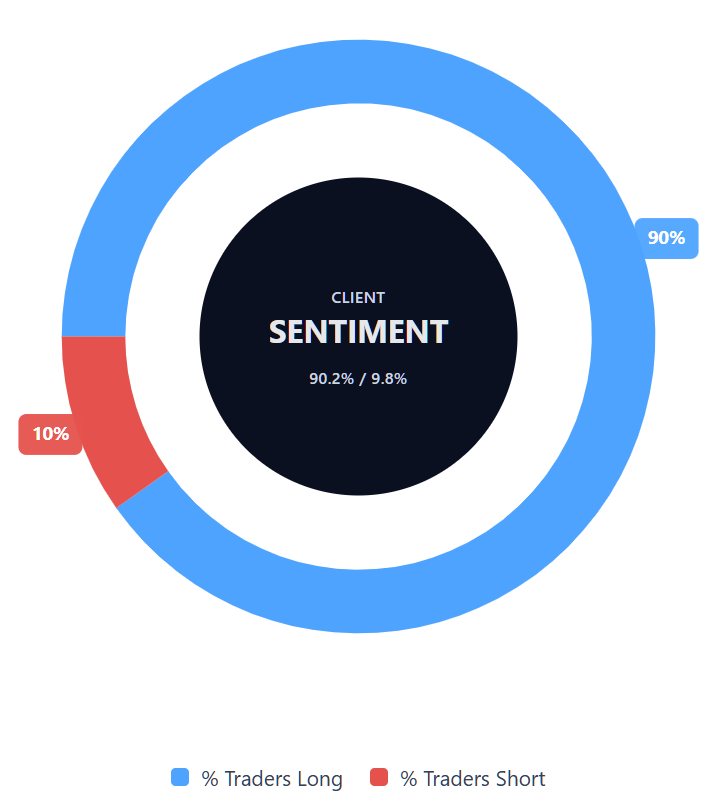
Capital.com’s client sentiment for Cardano CFDs
As of 11 March 2026, Capital.com client positioning in Cardano CFDs is 90.2% long vs 9.8% short, putting long positions ahead by 80.4 percentage points and indicating strong net-long positioning among Capital.com clients at this snapshot. This data reflects open positions on Capital.com and can change rapidly as market conditions evolve.
Summary – Cardano (2026)
- ADA trades at $0.26271 as of 3:25pm UTC on 11 March 2026, down approximately 21.2% year to date and 63.8% below its December 2024 high of $1.33.
- Moving averages from the 20-day through 200-day SMA all sit above the current price, which some traders interpret as consistent with a prevailing downtrend; the 14-day RSI at 45.26 reads neutral with no clear directional conviction.
- Classic pivot support sits at $0.2717, with the R1 resistance level at $0.3230 representing the first meaningful technical barrier to the upside.
- Key drivers include the scheduled Protocol 11 hard fork and Midnight privacy sidechain mainnet launch in March 2026, alongside Grayscale raising ADA’s weighting in its Smart Contract Platform Fund.
- Broader macro headwinds, including US trade policy uncertainty and a risk-off crypto market tone, have weighed on ADA alongside intensifying competition from rival layer-1 networks.
Past performance is not a reliable indicator of future results.
FAQ
What is the latest Cardano crypto price prediction?
Who owns the most Cardano?
How many Cardano coins are there?
Could Cardano’s price go up or down?
Should I invest in Cardano?
This article is for information only and does not provide financial advice. Whether Cardano is suitable depends on your objectives, time horizon and risk tolerance, as crypto assets can be volatile and losses are possible. You may want to compare different sources, review Cardano’s fundamentals and market structure, and consider how leverage would change your risk if trading CFDs. If you’re unsure, consider seeking independent professional advice.
Can I trade Cardano (ADA) CFDs on Capital.com?
Yes, you can trade Cardano CFDs on Capital.com. Trading cryptocurrency CFDs lets you speculate on price movements without owning the underlying asset and to take long or short positions. However, contracts for difference (CFDs) are traded on margin, and leverage amplifies both profits and losses. You should ensure you understand how CFD trading works, assess your risk tolerance, and recognise that losses can occur quickly.