BYD stock forecast: Third-party price targets
BYD Co Ltd is a Hong Kong-listed automotive and battery manufacturer, with operations spanning electric vehicles, components and energy storage across China and international markets. Explore third-party 1211 price targets and technical analysis.
BYD Company Limited (1211) is trading around $98 HKD as of 2:44pm UTC on 18 February 2026, hovering just below the intraday high of $98.80 HKD and above the session low of $98.15 HKD.
The stock trades against a backdrop of softer sentiment towards Chinese automakers after BYD reported a roughly 30% year-on-year drop in January vehicle sales and led a sector sell-off in early February (Reuters, 2 February 2026). Subsequent headlines have focused on the group’s international expansion, including new model launches aimed at Europe (Yahoo Finance, 17 February 2026). The broader Hong Kong equity market remains relatively range-bound in mid-February, with benchmark indices fluctuating around late-2025 levels, creating a mixed backdrop for large-cap shares (Trading Economics, 18 February 2026).
BYD stock forecast 2026–2030: Third-party price targets
As of 18 February 2026, third-party BYD stock predictions show a broad spread in 12-month price objectives, as brokers reassess assumptions around electric-vehicle demand, inventory trends and export growth.
Jefferies (broker research)
Jefferies maintains a Hold stance and set a 12-month target price of $105 HKD for BYD’s H-shares, basing its valuation on a projected 2026 price-to-earnings multiple of 20 times. The broker notes that the target reflects a roughly 40% correction from the stock’s peak and incorporates potential catalysts such as an upcoming Tech Day and new model launches, set against weaker domestic demand and intensified competition (AASTOCKS, 11 February 2026).
Citigroup (broker research)
Citigroup reiterates a Buy rating with a target price of $174 HKD for BYD’s H-shares, citing its latest assessment of dealer inventory and wholesale run-rates into the first quarter of 2026. The bank highlights that domestic inventory had eased modestly by end-January, while stressing that pricing and new product launches in late February and early March remain important variables as wholesale volumes face year-on-year pressure (AASTOCKS, 11 February 2026).
Moomoo (broker forecast aggregation)
Moomoo’s 1211 stock forecast page reports an average 12-month target of about $280.47 HKD, with a maximum estimate near $458.80 HKD and a minimum around $80 HKD. The platform states that these figures aggregate multiple institutional analyst estimates for the next 12 months, reflecting a range of assumptions on sector growth and overseas margin trends (Moomoo, 17 February 2026).
Predictions and third-party forecasts are inherently uncertain, as they cannot fully account for unexpected market developments. Past performance is not a reliable indicator of future results.
1211 stock price: Technical overview
The 1211 stock price is trading around $98 HKD as of 2:44pm UTC on 18 February 2026, holding just above the Classic Pivot at 98.19 and below first resistance at 102.57. On the daily chart, the simple moving-average cluster sits near the 20/50/100/200-day moving averages at roughly 97 / 97 / 100 / 112. Price is currently hovering just above the shorter-term averages but remains below the 100- and 200-day indicators.
The 14-day RSI, at around 53, sits in neutral territory. Meanwhile, the ADX near 15 suggests a weak or non-directional trend rather than a strong directional move.
On the upside, the classic R1 near 102.57 marks the next immediate level to watch. A daily close above this area would bring the R2 region around 107.38 into focus. On pullbacks, initial support aligns with the classic pivot at 98.19. A sustained move below this level could expose the S1 area near 93.37 (TradingView, 18 February 2026).
This technical analysis is provided for informational purposes only and does not constitute financial advice or a recommendation to buy or sell any instrument.
BYD share price history (2024–2026)
BYD’s H-shares (1211 stock price) have experienced significant price swings over the past two years, moving from triple-digit levels to below $100 HKD as sentiment towards Chinese electric-vehicle manufacturers shifted. On 18 February 2025, the stock closed at $366.40 HKD before rallying above $460 HKD by late May 2025 and trading broadly within the $370–$420 HKD range into early April.
From June 2025 onwards, momentum reversed. After a brief spike near $409.45 HKD in early June, the share price entered a sustained decline, falling into the low-$100 HKD area by late October and finishing 2025 at $95.25 HKD.
Trading in early 2026 has been comparatively stable in price terms. BYD closed at $98.60 HKD on 2 January 2026 and was last seen around $98 HKD on 16 February 2026. At that level, the stock trades roughly 73% below its price one year earlier and is broadly flat year to date as of mid-February. Past performance is not a reliable indicator of future returns.
Past performance is not a reliable indicator of future results. Share prices are indicative and may differ from live market prices.
BYD (1211): Capital.com analyst view
BYD’s H-share price has undergone a pronounced reset over the past two years, rising above $460 HKD in May 2025 before returning to double-digit territory by early 2026. This shift coincided with changing sentiment towards Chinese electric-vehicle manufacturers, as earlier expectations around growth and exports gave way to concerns over competition, pricing pressure and demand trends.
Recent trading around $98 HKD has been relatively range-bound. The market appears to be weighing weaker sector data against ongoing international expansion and product development. Developments such as new model launches, inventory data or policy measures could influence price expectations. However, if results diverge from market assumptions or broader risk sentiment deteriorates, volatility may persist.
Given these cross-currents, both stabilisation and further downside remain possible outcomes. Traders should consider their risk tolerance and time horizon when evaluating exposure to volatile equity CFDs.
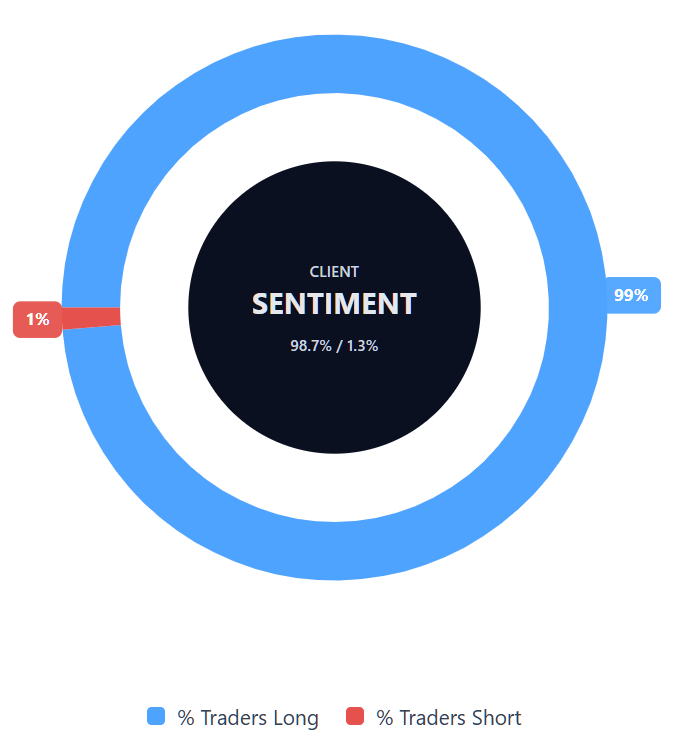
Capital.com’s client sentiment for BYD CFDs
As of 18 February 2026, Capital.com client positioning in BYD CFDs is skewed, with 98.7% buyers versus 1.3% sellers – a difference of roughly 97 percentage points. This distribution indicates that most open CFD positions on the platform currently favour the long side. Client sentiment reflects open positions at a specific point in time and can change rapidly. It should not be viewed in isolation when assessing market conditions.
Summary – BYD 2026
- BYD’s H-shares moved from the mid-$200 HKD area at the start of 2025 to a peak above $465 HKD in May before reversing lower.
- From mid-2025, the price trended down from above $400 HKD in early June to close the year at $95.25 HKD on 31 December 2025.
- Technical indicators currently show the price around $98 HKD trading just above shorter-term moving averages but below the 100- and 200-day averages, with RSI in neutral territory – a configuration that reflects indecision rather than a clear directional bias at the time of writing.
Past performance is not a reliable indicator of future results.
FAQ
Who owns the most BYD stock?
BYD’s shareholder base includes a mix of founders, strategic investors and institutional shareholders. Historically, founder Wang Chuanfu has held a significant stake, while Berkshire Hathaway has been a notable long-term investor through one of its subsidiaries. Ownership levels can change over time due to share sales, placements or other corporate actions. For the latest breakdown of major shareholders, refer to BYD’s most recent annual report or Hong Kong Exchange filings, as these provide the most up-to-date information.
What is the 5-year BYD share price forecast?
There is no single, agreed five-year 1211 stock forecast. Most publicly available analyst targets focus on a 12-month horizon rather than longer-term projections. Over a five-year period, outcomes may depend on factors such as electric-vehicle demand, competitive dynamics, regulation, battery development and global expansion. Longer-term forecasts are inherently uncertain and subject to revision as new information becomes available. Any extended projection should be viewed as a scenario rather than a fixed expectation.
Is BYD a good stock to buy?
Whether BYD is considered ‘good’ depends on an individual’s objectives, risk tolerance and time horizon. The company operates in a competitive and evolving sector, which can create both opportunity and volatility. Recent price movements and the wide dispersion in analyst targets reflect differing assessments of demand trends, margins and overseas growth. This information is provided for educational purposes only and does not constitute investment advice. Any decision to gain exposure should take personal circumstances and the risks associated with share and CFD trading into account.
Could BYD stock go up or down?
BYD’s share price can move in either direction, influenced by earnings results, vehicle sales data, policy developments, competitive pressures and broader market conditions. Technical indicators currently point to a neutral configuration, while analyst targets span a wide range, underscoring uncertainty rather than a clear directional bias. As with all listed shares, volatility may increase around corporate announcements or macroeconomic events. Past performance is not a reliable indicator of future results.
Should I invest in BYD stock?
Deciding whether to invest in BYD requires careful consideration of your financial position, investment goals and tolerance for risk. Shares and share CFDs can fluctuate significantly in price, and leverage amplifies both profits and losses. You may wish to seek independent financial advice before making any investment decision. Exposure to a single company or sector should form part of a broader, diversified approach rather than a concentrated position.
Can I trade BYD CFDs on Capital.com?
Yes, you can trade BYD CFDs on Capital.com. Trading share CFDs lets you speculate on price movements without owning the underlying asset and to take long or short positions. However, contracts for difference (CFDs) are traded on margin, and leverage amplifies both profits and losses. You should ensure you understand how CFD trading works, assess your risk tolerance, and recognise that losses can occur quickly.