BYD Company stock forecast: Argentina and Mexico orders
BYD is a Hong Kong-listed EV manufacturer whose shares have drawn attention after reported export orders from Argentina and Mexico, even as weaker early-2026 domestic sales remain a key factor. Past performance is not a reliable indicator of future results. Explore third-party 1211 price targets.
BYD Company Limited (1211) is trading at $105.05 HKD as of 11:28am UTC on 17 March 2026, within an intraday range of $96.20–$107.25 HKD. Past performance is not a reliable indicator of future results.
Price action follows a confluence of drivers. BYD reportedly secured approximately 100,000 combined vehicle export orders from Argentina and Mexico, which supported the shares against a backdrop of sharply lower domestic sales (The Edge Malaysia, 16 March 2026). Combined January-February 2026 volumes were down roughly 36% year on year, partly attributed to the reinstatement of a 5% purchase tax on new energy vehicles and seasonal effects from the Lunar New Year (CNBC. 5 March 2026). Separately, BYD's 5 March technology event showcased its second-generation Blade Battery and megawatt flash-charging platform (Reuters, 5 March 2026), while the broader Hong Kong market provided a modestly constructive backdrop, with the Hang Seng Index edging up 0.19% to approximately 25,883 on 17 March 2026 (Trading Econimcs, 17 March 2026).
BYD Company stock forecast 2026–2030: Third-party price targets
As of 17 March 2026, third-party BYD Company stock predictions reflect a spread of views shaped by domestic EV demand trends, export momentum, competitive positioning, and BYD's ongoing product and technology cycle.
Jefferies (broker note – Hold)
Jefferies carries a Hold rating on BYD H-shares with a 12-month target of $105 HKD, derived from a 20x 2026 price-to-earnings multiple, as confirmed via Investing.com's coverage of the broker note. The bank cites a roughly 40% correction from the stock's peak as having largely priced in near-term negatives, while flagging upcoming model launches and Tech Day events as potential sentiment catalysts (Investing.com, 11 February 2026).
Citi (broker note – Buy)
Citigroup reiterates a Buy rating on BYD with a 12-month target price of $174 HKD. The bank projects combined domestic and export volumes reaching 220,000–250,000 units from March onward, citing stable inventory levels as February retail and wholesale volumes converged, with the Fangchengbao Titanium 3 Fast Charge and the Leopard 7 launch in April cited as near-term volume drivers (Futunn News, 17 March 2026).
Nomura (broker note – Buy)
Nomura maintains a Buy rating on BYD with a 12-month target price of $132 HKD. The broker notes that BYD's second-generation Blade Battery launch could support additional supply agreements, while flagging that a meaningful domestic sales recovery remains the central condition for a sustained re-rating (AASTOCKS, 6 March 2026).
Investing.com (consensus aggregation)
Investing.com aggregates 27 analyst 12-month 1211 stock forecasts, reporting an average target of $162.29 HKD, a high estimate of $265.59 HKD, and a low of $93 HKD, with a consensus rating of Strong Buy. The wide dispersion across estimates reflects diverging assumptions on the pace of the domestic sales recovery, international expansion margins, and the degree of competitive pressure from rival Chinese EV makers (Investing.com, 17 March 2026).
Predictions and third-party forecasts are inherently uncertain, as they cannot fully account for unexpected market developments. Past performance is not a reliable indicator of future results.
1211 stock price: Technical overview
On the daily chart, the 1211 stock price trades at $105.05 HKD as of 11:28am UTC on 17 March 2026, sitting above a tightly bunched moving-average shelf where the 20-, 50-, and 100-day SMAs converge near $98, $97, and $98. The 200-day SMA at $108.05 HKD sits above the current price, marking the nearest longer-term overhead reference. All SMAs from the 10-day through the 100-day register buy signals, with the 20-over-50 alignment intact, which keeps the near-term structure constructive. The 200-day EMA at $103.12 HKD sits between the last price and the 200-day SMA, and price trading through it is worth noting as the stock works into that overhead zone.
Momentum is firm but not stretched. The 14-day RSI stands at 62.71, consistent with a trend that has momentum behind it without being technically stretched. The ADX (14) reads 14.89, below the 15 threshold, indicating that the current trend lacks strong directional conviction. By this measure, the recent surge from the early-March lows has yet to translate into a confirmed trend signal.
On the topside, the classic R1 pivot at $101.20 HKD has already been cleared in the current session, bringing R2 near $107.45 HKD into view as the next reference. A daily close through that level would put the R3 area around $120.05 HKD back in focus over a longer horizon.
On pullbacks, the classic pivot (P) at $94.85 HKD represents initial support, with the tightly stacked 20-, 50-, and 100-day SMA shelf just above providing a broader $97-$98 HKD floor. A daily close below that cluster would blunt the near-term structure and could open the way for a move towards S1 near $88.60 HKD (TradingView, 17 March 2026).
This is technical analysis for informational purposes only and does not constitute financial advice or a recommendation to buy or sell any instrument.
BYD Company share price history (2024–2026)
BYD's H-shares (1211), listed on the Hong Kong Stock Exchange, have covered a wide range over the past two years, reflecting the company's shifting fortunes in both domestic and international EV markets.
1211’s stock price opened in March 2024 around $217.05 HKD before drifting lower through the spring, touching a local trough near $196.15 HKD in late April 2024. A partial recovery followed through summer and into autumn, with the stock reaching $319.95 HKD on 7 October 2024 - the highest level seen in this two-year window - before pulling back into year-end. BYD (1211) closed 2024 at $267.30 HKD.
The story of 2025 was one of heightened volatility. The stock traded in a relatively narrow $249-$295 HKD band through the first quarter before staging a dramatic surge, briefly touching $478.50 HKD intraday on 23 May 2025, a level that marked the upper extreme of the period covered here. A sharp reversal followed in June, with prices collapsing from above $400 HKD to close the year at $95.25 HKD on 31 December 2025, reflecting the significant post-split or restructuring adjustment visible in the data.
BYD (1211) closed at $105.05 HKD on 17 March 2026, which is approximately 10.3% higher year to date than the 31 December 2025 close of $95.25 HKD, though approximately 60.7% lower year on year relative to the 17 March 2025 close of $386.20 HKD, a differential that reflects the sharp price-level adjustment seen in mid-2025.
Past performance is not a reliable indicator of future results. Share prices are indicative and may differ from live market prices.
BYD Company (1211): Capital.com analyst view
BYD's H-share performance over the past two years reflects the tension between the company's long-term ambitions and near-term headwinds. The sharp price adjustment seen in mid-2025 reset valuations considerably, and the recovery from early-March 2026 lows near $91.05 HKD to the current $105.05 HKD suggests renewed interest, supported in part by overseas order momentum and BYD's technology showcase events. That said, the stock remains well below its 2025 highs, and the domestic sales weakness recorded in January-February 2026 serves as a reminder that demand recovery is not yet confirmed. Any further softening in China's EV market could weigh on sentiment despite the export narrative.
Analyst targets currently span a wide range - from $105 HKD to $174 HKD across major brokers - which itself signals meaningful uncertainty around the outlook. BYD's technology differentiation and expanding global footprint represent credible long-term arguments for the stock, while competitive pressures from domestic rivals, policy risk around EV incentives, and broader macroeconomic sensitivity continue to present material downside risks that investors should weigh carefully.
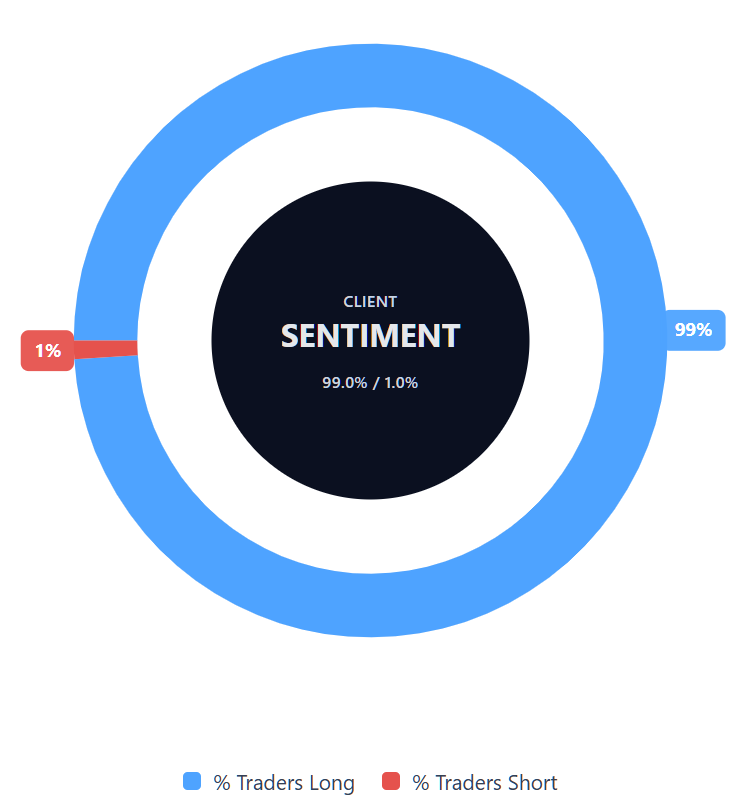
Capital.com’s client sentiment for BYD Company CFDs
As of 17 March 2026, Capital.com client positioning in BYD Company CFDs is one-sided towards longs: 99% buyers and 1% sellers, putting buyers ahead by 98 percentage points. This snapshot reflects open positions on Capital.com and can change.
Summary – BYD Company 2026
- BYD (1211) is trading at $105.05 HKD as of 11:28am UTC on 17 March 2026, within an intraday range of $96.20–$107.25 HKD.
- The 14-day RSI stands at 62.71 – in firm but not overstretched territory - with the classic R2 pivot at $107.45 HKD marking the nearest topside reference on a sustained daily close.
- Key upside drivers include approximately 100,000 combined export orders from Argentina and Mexico, the second-generation Blade Battery launch, and megawatt flash-charging technology unveiled at BYD's March 2026 Tech Day.
- Domestic January-February 2026 NEV sales fell sharply year on year, with China's overall NEV retail sales down 25.7% in the first two months of 2026 - a headwind that could limit near-term upside.
Past performance is not a reliable indicator of future results.
FAQ
Who owns the most BYD stock?
What is the 5 year BYD share price forecast?
Is BYD a good stock to buy?
Could BYD stock go up or down?
Should I invest in BYD stock?
Can I trade BYD CFDs on Capital.com?
Yes, you can trade BYD Company CFDs on Capital.com. Trading share CFDs lets you speculate on price movements without owning the underlying asset and to take long or short positions. However, contracts for difference (CFDs) are traded on margin, and leverage amplifies both profits and losses. You should ensure you understand how CFD trading works, assess your risk tolerance, and recognise that losses can occur quickly.