BYD Company stock forecast: Blade Battery launch, flash charge plan
BYD Company (1211) is a Hong Kong-listed EV and battery manufacturer; on 5 March 2026 it unveiled its second-generation Blade Battery and outlined plans for 20,000 flash-charging stations. Explore third-party 1211 price targets. Past performance is not a reliable indicator of future results.BYD Company Limited (1211) is trading at $92.80 HKD as of 3.17pm UTC on 5 March 2026, within an intraday range of $91-$95.80 HKD. The stock sits near the lower end of its session range and remains close to its 52-week low of $88.50 HKD, set on 4 February 2026, having retreated sharply from a peak above $159 HKD in May 2025. Past performance is not a reliable indicator of future results.
Price action reflects competing catalysts on 5 March 2026. BYD held a ‘disruptive technology’ event at its Shenzhen headquarters, where it launched its second-generation Blade Battery (Reuters, 5 March 2026), reported to charge from 10% to 70% in five minutes, alongside plans for 20,000 flash-charging stations by end-2026 (CarNewsChina.com, 5 March 2026). This product news comes alongside a reported 36% year-on-year decline in February NEV sales, with the company running below 50% capacity, according to AJ Investment Research (X, 2 March 2026). The broader Hong Kong market provided a softer backdrop, with the Hang Seng Index trading around 25,583 on 5 March 2026, down from 26,190 on 3 March 2026, as broader risk sentiment remained weak (MarketScreener, 5 March 2026).
BYD Company stock forecast 2026–2030: Third-party price targets
As of 5 March 2026, third-party BYD Company stock predictions reflect a wide spread of views, shaped by differing assumptions on domestic NEV sales recovery, the pace of overseas market expansion, and the competitive impact of new battery and platform technology.
J.P. Morgan (Buy reiteration)
J.P. Morgan analyst Nick Lai reiterated a Buy rating and set a 12-month H-share price target of $110 HKD. Lai cited BYD’s four overseas production bases in Thailand, Indonesia, Brazil, and Hungary as central to the more positive scenario, with full ramp-up of those facilities expected to drive volume growth amid softening domestic demand (The Globe and Mail, 9 February 2026).
Bernstein SocGen (Outperform reaffirmation)
Bernstein SocGen reaffirmed an Outperform rating and a $130 HKD price target, unchanged from its prior position. The firm cited BYD’s broad global EV portfolio and growing brand awareness as the basis for its view that the company is well placed to compete globally, depending on market conditions and execution (Investing.com, 2 March 2026).
Investing.com (consensus aggregation)
Investing.com aggregates 27 analyst 12-month price targets for BYD Co Ltd-H, reporting an average target of $162.29 HKD, a high estimate of $265.59 HKD, and a low of $93 HKD, with an overall consensus rating of Strong Buy as of March 2026. The broad range of estimates reflects diverging assumptions around the pace of domestic sales recovery, international expansion margins, and the competitive response from rival EV makers (Investing.com, 5 March 2026).
Predictions and third-party forecasts are inherently uncertain, as they cannot fully account for unexpected market developments. Past performance is not a reliable indicator of future results.
1211 stock price: Technical overview
The 1211 stock price is trading at $92.80 HKD as of 3.17pm UTC on 5 March 2026. The price sits below a broad set of trend measures, with the 10-day exponential moving average at $95.91 HKD and the 10-day simple moving average at $96.65 HKD, both signalling sell. The 20-day exponential moving average is $96.29 HKD and the 20-day simple moving average is $95.63 HKD, which also signal sell. Longer-term measures point the same way: the 100-day exponential moving average is $99.83 HKD, the 100-day simple moving average is $98.48 HKD, the 200-day exponential moving average is $103.46 HKD, and the 200-day simple moving average is $109.99 HKD, all signalling sell. Taken together, these readings suggest the market remains below its recent average levels across multiple timeframes.
Momentum signals are mixed. Relative strength index (14) reads 42.42 (neutral), which aligns with subdued momentum rather than an extreme condition. Stochastic %K (14, 3, 3) is 31.67 (neutral), while stochastic RSI fast (3, 3, 14, 14) is 12.63 (neutral). Commodity channel index (20) stands at -54.31 (neutral), and the average directional index (14) is 11.52 (neutral), which indicates a weak trend environment. Williams percent range (14) prints -83.33 (neutral), while the awesome oscillator is -1.59 (neutral) and bull bear power is -4.09 (neutral). Two indicators flag weaker momentum: momentum (10) is -5.20 (sell) and MACD level (12, 26) is -0.36 (sell). The ultimate oscillator (7, 14, 28) reads 46.09 (neutral). Overall, the balance of signals points to soft momentum, with trend strength remaining limited.
Pivot levels provide nearby reference points. Using classic pivots, the pivot point sits at $94.85 HKD. Resistance levels appear at $101.20 HKD (R1), $107.45 HKD (R2), and $120.05 HKD (R3). Support levels appear at $88.60 HKD (S1), $82.25 HKD (S2), and $69.65 HKD (S3). These levels do not predict direction, but traders often use them to frame potential support and resistance areas (TradingView, 5 March 2026)..
This is technical analysis for informational purposes only and does not constitute financial advice or a recommendation to buy or sell any instrument.
BYD Company share price history (2024–2026)
BYD’s H-shares listed on the Hong Kong Stock Exchange closed at $192.85 HKD on 6 March 2024 and spent most of that year in a steady recovery, rising roughly 38.6% to close 2024 at $267.30 HKD, lifted by record annual EV sales and growing international expansion.
1211’s stock price hit its stride in early 2025, climbing sharply through February and March before a brief dip to $313.55 HKD on 7 April 2025 amid global tariff uncertainty. It recovered quickly, surging to a peak close of $465.30 HKD on 23 May 2025 – the highest level in the two-year window – as investors responded to strong export growth and a rapid succession of product launches.
From that peak, however, the shares reversed hard. A combination of intensifying domestic price competition, a reported 36% year-on-year drop in February 2026 NEV sales, and broader risk-off sentiment in Hong Kong pushed the stock down more than 80% from its May 2025 high. BYD Company (1211) closed 2025 at $95.25 HKD, marking a full-year decline of approximately 63.1%.
BYD Company (1211) is trading at $92.80 HKD as of 5 March 2026, approximately 2.6% down year to date and 73.4% lower year on year.
Past performance is not a reliable indicator of future results. Share prices are indicative and may differ from live market prices.
BYD Company (1211): Capital.com analyst view
BYD’s H-shares experienced a dramatic swing over the past year, surging to a peak close of $465.30 HKD in May 2025 on the back of record export momentum and a rapid pipeline of technology launches, before shedding more than 80% of that value by early March 2026. The company’s 5 March 2026 unveiling of its second-generation Blade Battery and Megawatt Flash Charge technology illustrates the pace of its product development, which some analysts view as a potential competitive advantage in the global EV market. That said, a reported 36% year-on-year decline in February 2026 NEV sales highlights countervailing pressure from intensifying domestic price competition and softer consumer demand in China, which could continue to weigh on revenue and margin expectations.
On a broader view, BYD’s expanding international footprint offers a potential offset to domestic headwinds, though overseas growth carries its own risks, including regulatory barriers, tariff exposure, and currency volatility. The stock’s sharp de-rating from its 2025 highs may reflect a recalibration of growth expectations rather than a change in the company’s underlying position, but the pace and durability of any recovery will likely depend on both domestic demand trends and the reception of its new technology platforms in global markets.
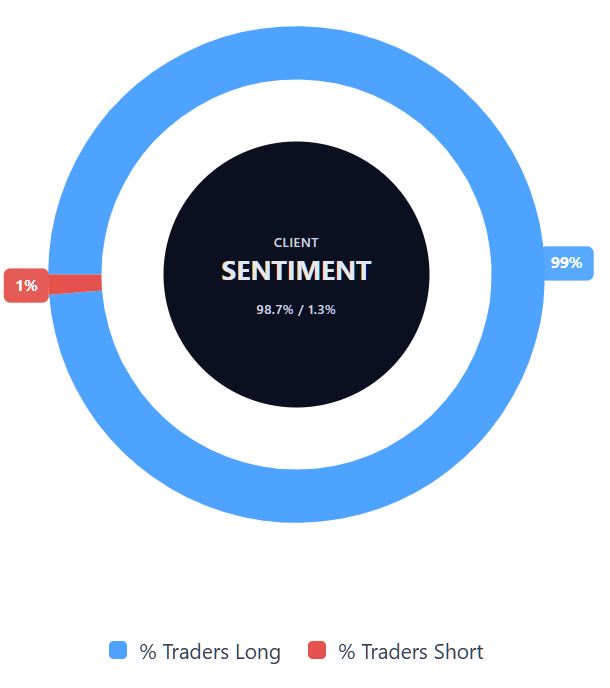
Capital.com’s client sentiment for BYD Company CFDs
As of 5 March 2026, Capital.com client positioning in BYD Company CFDs is skewed toward longs: 98.7% buyers vs 1.3% sellers, putting buyers ahead by 97.4 percentage points and placing sentiment firmly in one-sided territory toward longs. This snapshot reflects open positions on Capital.com and can change.
Summary – BYD Company 2026
- BYD Company (1211) trades at $92.80 HKD as of 3.17pm UTC on 5 March 2026, down over 80% from its May 2025 peak close of $465.30 HKD.
- All key moving averages – 20/50/100/200-day simple moving averages at $95.63 HKD / $96.48 HKD / $98.48 HKD / $109.99 HKD – sit above the current price, indicating a bearish trend across all tenors.
- Classic pivot support sits at $94.85 HKD, with S1 at $88.60 HKD the next meaningful level; R1 at $101.20 HKD is the nearest overhead hurdle.
- BYD unveiled its second-generation Blade Battery on 5 March 2026, offering over 1,000 km range and 10-70% charge in five minutes, alongside plans for 20,000 flash-charging stations by end-2026.
- February 2026 NEV sales declined approximately 36% year on year, highlighting ongoing domestic demand weakness and intensifying price competition in China’s EV market.
Past performance is not a reliable indicator of future results.
FAQ
Who owns the most BYD Company stock?
What is the 5 year BYD Company share price forecast?
Is BYD Company a good stock to buy?
Could BYD Company stock go up or down?
Should I invest in BYD Company stock?
Can I trade BYD Company (1211) CFDs on Capital.com?
Yes, you can trade BYD Company CFDs on Capital.com. Trading share CFDs lets you speculate on price movements without owning the underlying asset and to take long or short positions. However, contracts for difference (CFDs) are traded on margin, and leverage amplifies both profits and losses. You should ensure you understand how CFD trading works, assess your risk tolerance, and recognise that losses can occur quickly.