Bitcoin price prediction: ETF outflows and US–Iran tensions
Bitcoin remains driven mainly by external factors, with ETF outflows, stronger US economic data and renewed US–Iran tensions all shaping price action in early April 2026. Past performance is not a reliable indicator of future results. Explore third-party BTC price targets and technical analysis.
Bitcoin (BTC/USD) is trading at $66,364 in early European trading at 10:50am UTC on 2 April 2026, within an intraday range of $66,302.10–$69,196.60. Past performance is not a reliable indicator of future results.
Price action continues to be shaped by macroeconomic and geopolitical forces rather than crypto-specific catalysts. Geopolitical uncertainty tied to the ongoing US–Iran conflict remains a primary headwind, with Brent crude rebounding to around $107.49 after President Trump's 1 April address failed to deliver a clear de-escalation path, according to Saxo Bank. Elevated oil prices are feeding inflation concerns and keeping rate-cut expectations in check, which in turn can weigh on risk assets, including digital currencies (Saxo Bank, 2 April 2026).
US spot Bitcoin ETFs recorded approximately $296 million in net outflows in the week of 24–27 March, ending a four-week inflow streak. CoinShares noted that digital-asset investment products saw $414 million in outflows in the week through 30 March (CoinShares, 30 March 2026), while US ISM manufacturing rose to 52.7 in March, its strongest reading since August 2022, suggesting that growth remains resilient but inflationary pressure is not easing (ISM, 1 April 2026).
Bitcoin price prediction 2026-2030: Analyst price target view
As of 24 March 2026, third-party BTC price predictions reflect a market in consolidation near the $66,000–$70,000 zone, with analysts split on whether the current phase represents a cycle reset or a precursor to a renewed leg higher. The following targets summarise leading third-party predictions published within that window.
CoinCodex (algorithmic five-day model)
CoinCodex projected BTC would reach $76,045 by 31 March 2026, representing a 9.45% rise from the then-current price of $69,329, based on its technical-indicator model using data as of 26 March 2026. The service flagged an overall bearish sentiment at the time, with 80% of its tracked indicators signalling negative momentum, while noting key resistance levels at $72,044, $72,745, and $73,539 (CoinCodex, 26 March 2026).
Coinpedia (breakout condition analysis)
Coinpedia notes that BTC has failed to break above $75,000 over the month prior to publication, with price drifting near $68,739 at press time on 26 March 2026, amid the expiry of $16.4 billion in Bitcoin and Ethereum options and renewed US–Iran geopolitical tensions. The piece cites on-chain data showing wallets holding 10–10,000 BTC increased their positions by 0.45%, equivalent to 61,568 BTC, over the prior month, and flags that a sustained divergence between long-term holder accumulation and short-term holder selling has historically preceded shifts in bullish momentum (Coinpedia, 26 March 2026).
Yahoo Finance (contributor $100,000 re-test)
A separate Yahoo Finance analysis targets $100,000 by year-end 2026, noting BTC has retraced to its 2024 price level and arguing that the 2024 cycle high represents a natural re-test objective in a year historically characterised by post-peak consolidation. The contributor references the 2018 and 2022 post-cycle drawdown patterns as context, while acknowledging that elevated macro uncertainty keeps the downside scenario open (Yahoo Finance, 17 March 2026).
Predictions and third-party forecasts are inherently uncertain, as they cannot fully account for unexpected market developments. Past performance is not a reliable indicator of future results.
BTC price: Technical overview
The BTC/USD price trades at $66,364 as of 10:50am UTC on 2 April 2026, sitting below every major moving average on the daily chart. TradingView data shows the 20/50/100/200-day SMAs stacked at approximately $69,542 / $68,655 / $77,210 / $90,101, with price running beneath the full cluster, a configuration that reflects persistent selling pressure across all key time horizons.
Momentum indicators reinforce the subdued tone. The 14-day RSI reads 42, sitting in lower-neutral territory and offering no directional confirmation either way. The ADX (14) registers 15, just at the threshold that TradingView associates with a weak or non-trending environment, suggesting the current move lacks strong directional conviction.
The classic pivot point at $69,728 represents the nearest reference overhead; a daily close back above that level would bring R1 at $74,500 into view. The Hull moving average (9) at $67,418 sits just below current price and may act as a near-term reference. On pullbacks, the S1 classic pivot at $63,442 is the next structured support below, with S2 at $58,670 the subsequent reference if that level fails (TradingView, 24 March 2026).
This is technical analysis for informational purposes only and does not constitute financial advice or a recommendation to buy or sell any instrument.
Bitcoin price history (2024–2026)
BTC/USD’s price entered April 2024 trading around $68,600, already up sharply from its 2023 lows, as the approach of the April 2024 halving and the launch of US spot Bitcoin ETFs in January 2024 drew fresh institutional interest to the market.
BTC closed 2024 at approximately $93,406 , marking a strong annual gain, before extending that momentum into early 2025, briefly touching an all-time high of $126,287 on 6 October 2025. That peak proved short-lived, however. A broad reversal through Q4 2025 brought BTC back to around $87,524 at the end of December 2025, a decline of roughly 6.3% from the prior year-end close.
The selling has continued into 2026. BTC closed on 2 April 2025 at $82,527; one year on, BTC is trading at $66,364 as of 10:50am UTC on 2 April 2026, which is approximately 25.2% down year to date and 19.6% lower year on year.
Past performance is not a reliable indicator of future results. Share prices are indicative and may differ from live market prices.
Capital.com analyst view: Bitcoin
Bitcoin's price trajectory over the past year illustrates how quickly sentiment can shift in the cryptocurrency market. After reaching an all-time high of $126,287 in October 2025, BTC has retraced sharply, trading near $66,364 as of 2 April 2026, a decline of roughly 47% from that peak. The pullback reflects a confluence of factors: persistent macro headwinds, including elevated oil prices tied to US–Iran tensions; a reset in spot ETF flows after several strong inflow streaks; and broader risk-off positioning across global markets. For some analysts, the current range near $66,000–$70,000 represents a potential accumulation zone, supported by evidence of long-term holder buying. For others, the failure to reclaim $75,000 keeps the near-term outlook cautious.
The debate around Bitcoin's next directional move remains open. A clearer US regulatory framework and resumed ETF inflows could act as tailwinds, though deteriorating macro conditions or further geopolitical escalation could equally extend the drawdown. Volatility remains a defining characteristic of this asset class, and price swings in either direction can be rapid and substantial.
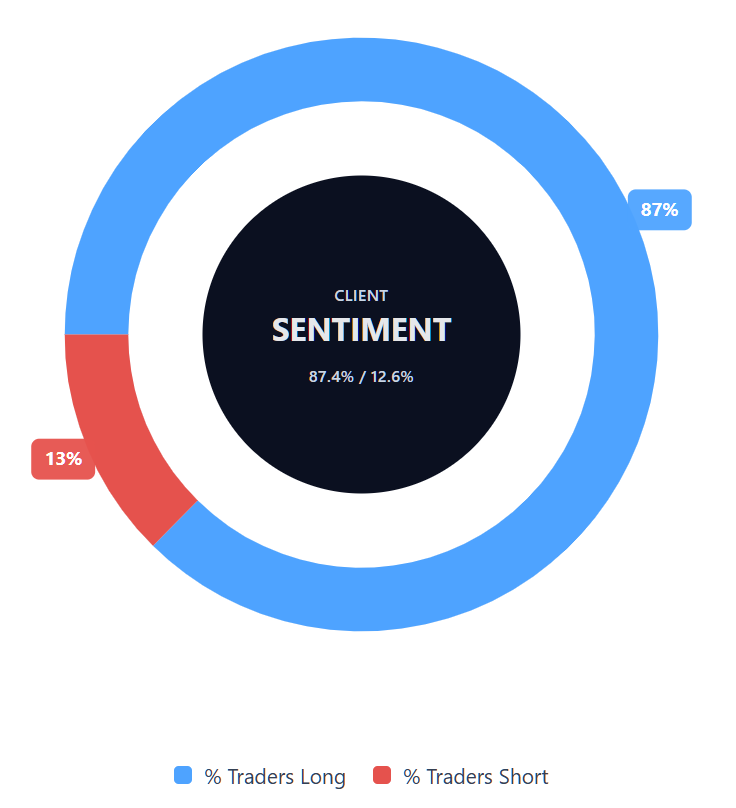
Capital.com’s client sentiment for Bitcoin CFDs
As of 24 March 2026, Capital.com client positioning in Bitcoin CFDs stands at 87.4% long and 12.6% short, which places sentiment firmly in one-sided long territory. This snapshot reflects open positions on Capital.com and can change.
Summary – Bitcoin (2026)
- BTC trades at $66,364 as of 10:50am UTC on 2 April 2026, down approximately 25.2% year to date and 19.6% year on year, after hitting an all-time high of $126,287 in October 2025.
- All daily moving averages signal sell, with the 20/50/100/200-day SMAs stacked between $69,542 and $90,101 above current price; the 14-day RSI sits at 42, in lower-neutral territory.
- The ADX reads 15, indicating a weak or non-trending environment, while the Hull moving average (9) at $67,418 sits just below current price as a near-term reference.
- Key drivers include US–Iran geopolitical tensions lifting oil prices, a reset in spot Bitcoin ETF flows following net outflows of around $296 million in the week of 24–27 March, and persistent macro uncertainty keeping rate-cut expectations in check.
Past performance is not a reliable indicator of future results.
FAQ
What is the latest Bitcoin crypto price prediction?
There isn’t a single consensus forecast for Bitcoin. In the article’s source window, short-term third-party targets clustered around the mid-$70,000s, while longer-dated 2026 forecasts extended into the $100,000–$155,000 range. More recent model-based forecasts still vary widely, which underlines how sensitive Bitcoin remains to ETF flows, macroeconomic conditions, regulation and geopolitics. Forecasts are estimates, not certainties, so they should be treated as one input rather than a prediction of what will happen.
Who owns the most Bitcoin?
No central register shows exactly who owns all Bitcoin, because holdings sit across wallets, exchanges, funds, companies and governments. However, Satoshi Nakamoto, Bitcoin’s pseudonymous creator, is widely regarded as the largest known individual holder. Beyond that, sizeable holdings are associated with public companies, ETFs, exchanges and state wallets linked to seizures or strategic reserves. Ownership can also change over time, so any ranking should be viewed as approximate rather than definitive.
How many Bitcoins are there?
Bitcoin’s supply is capped at 21 million coins by design. That maximum is fixed in the protocol, but not all of those coins are in circulation yet. New Bitcoin continues to enter circulation through mining, and current circulating supply is a little over 20 million. In practice, the available tradable supply may be lower because some coins are believed to be lost, while others are held for the long term and rarely move.
Could Bitcoin’s price go up or down?
Yes. Bitcoin’s price can rise or fall sharply, sometimes over short periods. Like other markets, it responds to supply and demand, but it can also react strongly to ETF flows, interest-rate expectations, regulation, market sentiment and geopolitical developments. That means bullish and bearish scenarios can both remain plausible at the same time. Volatility is a core feature of the asset, so traders often consider both upside potential and downside risk when assessing Bitcoin.
Should I invest in Bitcoin?
Whether Bitcoin is suitable depends on your objectives, time horizon, financial position and tolerance for risk. Bitcoin is a highly volatile asset, and large price swings can work for or against you. This article is for information only and does not provide investment advice or a recommendation. Before investing or trading, it’s worth considering the risks carefully, understanding how the market works, and deciding whether exposure to cryptocurrency fits your overall approach.
Can I trade Bitcoin CFDs on Capital.com?
Yes, you can trade Bitcoin CFDs on Capital.com. Trading crypto CFDs lets you speculate on price movements without owning the underlying asset and to take long or short positions. However, contracts for difference (CFDs) are traded on margin, and leverage amplifies both profits and losses. You should ensure you understand how CFD trading works, assess your risk tolerance, and recognise that losses can occur quickly.