Amazon stock forecast: US trade policy pressures
Amazon is a US technology company whose current outlook reflects stronger AWS growth expectations, softer March PMI data and ongoing concern over US trade policy. Past performance is not a reliable indicator of future results. Explore third-party AMZN price targets and technical analysis.
Amazon.com, Inc. (AMZN) is trading at $212.18 as of 4:34pm UTC on 25 March 2026, within a session intraday range of $206.94–$212.35. Past performance is not a reliable indicator of future results.
The session's tone reflects a confluence of factors: Barclays analyst Ross Sandler reported stronger AWS growth prospects and raised 2027 AWS revenue estimates, with third-quarter 2026 AWS growth now projected at 34% (Investing.com, 23 March 2026); meanwhile, the Nasdaq fell 0.8% on 24 March () and the US Composite PMI dropped to 51.4 in March 2026, its lowest in 11 months (Yahoo Finance, 24 March 2026), adding pressure on growth stocks amid lingering concerns over US trade policy and its potential impact on Amazon's third-party seller costs; the Federal Reserve left its target rate unchanged at 3.50%–3.75% at its most recent meeting, with new statement language described as leaning hawkish (S&P Global, 24 March 2026).
Amazon stock forecast 2026–2030: Third-party price targets
As of 25 March 2026, third-party Amazon stock predictions span $250–$300, with the majority of active ratings sitting at outperform or buy. The following targets summarise third-party institutional assessments published within that window; they do not constitute investment advice.
Needham & Company (buy, reiterated target)
Needham & Company reiterates a buy rating and a $265 AMZN stock forecast, with analyst Laura Martin maintaining her positive stance. The firm flags AWS reacceleration and AI-driven workload demand as the primary underpinnings of its 12-month view (MarketBeat, 17 March 2026).
Wolfe Research (outperform, trimmed target)
Wolfe Research lowers its 12-month price target on AMZN to $250 from $255, while retaining an outperform rating. The trim follows elevated near-term capital expenditure concerns, with the stock trading around $205.37 on volume of 62.4 million shares, approximately 21% above its average session volume (MarketScreener, 19 March 2026).
Barclays (buy, AWS-driven target)
Barclays reiterates a buy rating on AMZN, with a $300 price target, as reported by MarketScreener. The bank projects AWS revenue growth of approximately 34% in Q3 2026, raising its 2027 AWS estimates amid expectations that the OpenAI partnership will reinforce AWS's position in AI inference workloads (MarketScreener, 23 March 2026).
MarketBeat (consensus overview)
MarketBeat aggregates active analyst ratings, recording a Moderate Buy consensus with an average 12-month price target of $286.84, drawn from 58 analysts. The breakdown shows 53 buy ratings, 1 strong buy, and 4 hold ratings, with no sell ratings on record (MarketBeat, 20 March 2026).
Predictions and third-party forecasts are inherently uncertain, as they cannot fully account for unexpected market developments. Past performance is not a reliable indicator of future results.
AMZN stock price: Technical overview
The AMZN stock price trades at $212.18 as of 4:34pm UTC on 25 March 2026, sitting within the session's $206.94–$212.35 range and just below the classic pivot at $217.45. The moving-average picture is mixed: the 10- and 30-day simple moving averages (SMAs) at roughly $210 and $209 remain below the last price, while the 20-day SMA at $211 sits fractionally beneath current levels; beyond that, the 50/100/200-day SMAs at approximately $219/$226/$225 all lie above price, indicating that the broader trend context remains under pressure, per TradingView data. The Hull moving average (9) at $207.91 signals a buy, suggesting short-term momentum has recently turned upward from below current levels.
Oscillator readings from TradingView are predominantly neutral: the 14-day relative strength index stands at 48.56, placing it in mid-range territory with no directional lean, while the average directional index (14) at 16.93 suggests the trend lacks conviction in either direction. The MACD level (12, 26) at −1.97 registers a buy signal, as does the momentum (10) reading of −1.67, though both remain in mildly negative absolute territory.
On the topside, the classic R1 at $238.90 is the first reference above the current range; a daily close above the pivot at $217.45 would put that level in view. To the downside, the classic pivot point at $217.45 has flipped to overhead resistance from the current position, with initial support seen at S1 near $188.55 on the classic scale; the 100-day SMA shelf at $226.14 and 200-day SMA near $224.81 both sit above price, meaning a recovery towards those levels would be required before any longer-term MA support comes into play (TradingView, 25 March 2026).
This is technical analysis for informational purposes only and does not constitute financial advice or a recommendation to buy or sell any instrument.
Amazon share price history (2024–2026)
Amazon went public on Nasdaq in May 1997 at $18 per share. AMZN closed at $179.09 on 26 March 2024, the starting point of this two-year window.
AMZN’s stock price drifted broadly sideways through spring and early summer 2024, touching a near-term low of $162.86 on 5 August 2024 amid a broader tech sell-off, before recovering steadily into year-end. AMZN closed 2024 at $219.85, up roughly 23% from the March starting point, with a strong Q3 earnings print and accelerating AWS growth supporting the move.
2025 was sharply two-sided. The stock climbed to an all-time high of $253.46 on 3 November 2025, driven by AI infrastructure momentum and robust cloud spending, before a steep reversal. Amazon's Q4 2025 earnings report in early February 2026 disappointed on its profit outlook, and AMZN plunged around 17% in two sessions, closing at $198.14 on 5 February 2026—its lowest level since April 2025, when tariff-driven fears had already pushed the stock down to $168.39 on 21 April 2025.
AMZN closed at $212.26 on 25 March 2026, approximately 6.3% down year to date from its 2 January 2026 open of $226.63, but 5.8% higher year on year and 18.5% above its level from two years prior.
Past performance is not a reliable indicator of future results. Share prices are indicative and may differ from live market prices.
Amazon (AMZN): Capital.com analyst view
Amazon's performance over the past two years reflects the tension between its long-term structural strengths and near-term macro and cost pressures. AWS remains the company's most closely watched growth engine, with analysts pointing to AI-driven cloud demand as a potential catalyst for reacceleration; however, the $200 billion capital expenditure commitment for 2026 has raised questions among some market participants about the pace at which that investment will translate into free cash flow. On the tariff front, Amazon's diversified seller base and logistics scale may offer some insulation, though a prolonged trade dispute could weigh on third-party seller volumes and compress margins in its retail segment.
The stock's sharp pullback from its November 2025 all-time high of $253.46 to current levels near $212 also reflects broader sentiment shifts in the technology sector, where elevated valuations have made large-cap names more sensitive to earnings misses and guidance revisions. A recovery in consumer spending and a stabilisation of the macro outlook could support a re-rating, while a deterioration in either could extend the drawdown.
Capital.com’s client sentiment for Amazon CFDs
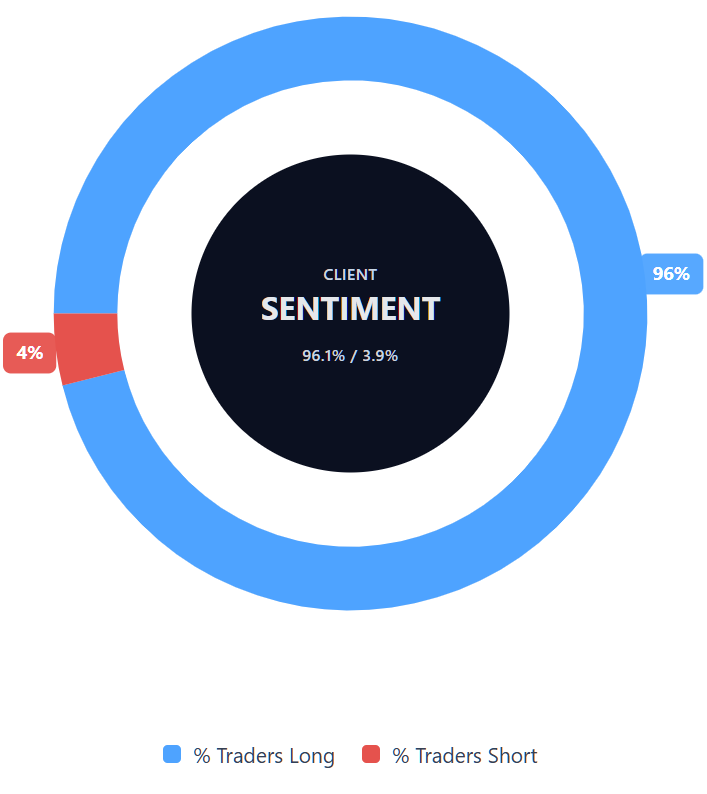
As of 25 March 2026, Capital.com client positioning in Amazon CFDs shows 96.1% buyers vs 3.9% sellers, which puts buyers ahead by 92.2 percentage points and places sentiment firmly in one-sided territory on the long side. This snapshot reflects open positions on Capital.com at the time of writing and can change rapidly as market conditions shift.
Summary – Amazon 2026
- AMZN trades at $212.18 as of 4:34pm UTC on 25 March 2026, up 18.5% over two years but 6.3% lower year to date.
- Price reached an all-time high of $253.46 on 3 November 2025 before a sharp post-earnings sell-off pushed the stock towards current levels.
- Technical indicators are mixed: short-term SMAs sit below price while the 50/100/200-day SMAs remain above, with RSI at 48.56 suggesting no clear directional momentum.
- The broader moving-average picture leans bearish at longer tenors, though the Hull moving average (9) and MACD both register buy signals on shorter time frames.
- Key drivers include AWS growth trajectory, AI infrastructure capital expenditure returns, and the potential impact of US trade tariffs on third-party seller margins.
Past performance is not a reliable indicator of future results.
FAQ
Who owns the most Amazon stock?
Amazon founder Jeff Bezos remains the company’s largest individual shareholder, based on publicly reported holdings. However, large institutional investors such as Vanguard and BlackRock also hold significant stakes through index funds and other investment vehicles. Ownership can change over time as insiders sell shares, institutions rebalance portfolios, or new filings are published. For that reason, it is usually more useful to focus on the latest regulatory disclosures than on any single static ownership figure.
What is the 5 year Amazon share price forecast?
Is Amazon a good stock to buy?
Could Amazon stock go up or down?
Amazon stock could move in either direction, depending on company-specific developments and wider market conditions. Factors such as earnings results, AWS growth, guidance revisions, capital expenditure trends, consumer demand, interest rates and trade policy can all influence price action. Technical indicators may also shape short-term trading behaviour, though they do not remove uncertainty. In practice, traders often assess both bullish and bearish scenarios rather than assuming a single outcome, especially when sentiment and fundamentals are mixed.
Should I invest in Amazon stock?
Can I trade Amazon CFDs on Capital.com?
Yes, you can trade Amazon CFDs on Capital.com. Trading share CFDs lets you speculate on price movements without owning the underlying asset and to take long or short positions. However, contracts for difference (CFDs) are traded on margin, and leverage amplifies both profits and losses. You should ensure you understand how CFD trading works, assess your risk tolerance, and recognise that losses can occur quickly.