Amazon stock forecast: Prime Video Ultra
Amazon is adjusting its Prime Video offering and pricing, while tariff-related cost pressures remain in focus as markets also watch the latest US Federal Reserve decision. Past performance is not a reliable indicator of future results. Explore third-party AMZN price targets and technical analysis.
Amazon.com, Inc. (AMZN) is trading at $216.05 in early European trading at 10:35am UTC on 18 March 2026, up from the prior session's close of $215.20, and within a tight intraday range of $210.18–$216.32. Past performance is not a reliable indicator of future results.
Sentiment around AMZN is supported by several concurrent developments. Amazon confirmed the launch of Prime Video Ultra, rebranding its ad-free streaming tier and raising the monthly price from $2.99 to $4.99, effective 10 April 2026, which analysts noted could support subscription revenue (9to5Mac, 13 March 2026). Separately, CEO Andy Jassy flagged in January that tariffs are beginning to feed through to product pricing, keeping cost and margin dynamics in focus (Reuters, 20 January 2026). At the macro level, the FOMC is concluding its two-day meeting today, with markets pricing in a near-certain rate held at the existing 3.50%–3.75% target range (Business Insider, 17 March 2026) amid a weaker February jobs report that showed a loss of 92,000 positions and unemployment at 4.4%. (Multibagg AI, 13 March 2026)
Amazon stock forecast 2026–2030: Third-party price targets
As of 18 March 2026, third-party Amazon stock predictions reflect ongoing debate over near-term capital expenditure absorption against longer-term AWS and AI monetisation upside. The following targets summarise broker and consensus views current during this period.
Wolfe Research (target raise – outperform)
Wolfe Research raises its AMZN 12-month price target to $255 from $250, retaining an Outperform rating. The firm's revised figure follows Amazon's Q4 2025 results, in which revenue of $213.39bn came in ahead of the $211.02bn consensus estimate, while EPS of $1.95 narrowly missed the $1.97 forecast by $0.02 (MarketBeat, 10 March 2026).
MarketBeat (broker consensus aggregate)
MarketBeat reports a consensus average 12-month AMZN stock forecast of $286.93, drawn from 58 analyst ratings, with 53 Buy, 4 Hold, and 1 Strong Buy, and no Sell ratings on record. The consensus rating stands at Moderate Buy, with individual targets ranging from $195 to $315 amid divergent views on the pace of AI capital expenditure payback (MarketBeat, 10 March 2026).
Wells Fargo (target trim – overweight)
Wells Fargo adjusts its AMZN price target modestly to $304 from $305, maintaining an Overweight rating. The minor reduction reflects updated margin assumptions amid Amazon's announced $200bn capital expenditure programme for 2026, while the firm retains a constructive view on AWS and advertising revenue growth (Yahoo Finance, 25 February 2026).
MarketScreener (broker consensus)
MarketScreener aggregates coverage from 67 analysts, placing the average 12-month AMZN target at $281.35, within a range of $175–$360, with a mean consensus rating of Buy. The spread across that range reflects differing assumptions on the timeline for AWS AI infrastructure to translate into margin expansion (MarketScreener, 17 March 2026).
Public.com (analyst consensus tracker)
Public.com places the analyst consensus 12-month AMZN price target at $282.23, with a Buy consensus across the contributing analyst base. The figure sits broadly in line with other aggregators, as recurring reference points across forecasts include AWS capacity expansion, the $50bn Amazon-OpenAI cloud partnership, and near-term tariff cost pass-through dynamics (Public.com, 16 March 2026).
Predictions and third-party forecasts are inherently uncertain, as they cannot fully account for unexpected market developments. Past performance is not a reliable indicator of future results.
AMZN stock price: Technical overview
The AMZN stock price trades at $216.05 as of 10:35am UTC on 18 March 2026, holding within the session range of $210.18–$216.32. Price sits above the short-term moving-average cluster of the 20/50/100/200-day SMAs at roughly $211 / $223 / $227 / $225, though the 50, 100, and 200-day SMAs all register sell signals, indicating that the stock remains beneath its medium- and longer-term averages. The 20-day SMA at $211 is the nearest support within that cluster, with price currently trading above it.
The 14-day RSI stands at 51.43, a neutral reading that does not indicate a clear directional bias. The ADX at 19.30 falls below the 25 threshold, consistent with a trend that lacks clearly established momentum in either direction.
To the topside, the classic R1 pivot at $238.90 is the first meaningful reference point; a daily close above that level would put the R2 area near $267.80 in view. The $220 level also warrants attention as a nearby round-number reference within 2% of the last price.
On pullbacks, the classic pivot at $217.45 offers initial support close to current levels. Beneath there, the 20-day SMA near $211 represents the nearest moving-average shelf; a daily close below that level could open the way to the S1 pivot at $188.55, which aligns broadly with the February range lows (TradingView, 18 March 2026).
This is technical analysis for informational purposes only and does not constitute financial advice or a recommendation to buy or sell any instrument.
Amazon share price history (2024–2026)
AMZN’s stock price opened March 2024 around $175, then climbed steadily through the spring and summer, reaching the $200 mark by early July 2024. The stock touched a two-year high of $259.06 on 3 November 2025, buoyed by strong Q3 2025 earnings and broad tech sector momentum.
After reaching that high, AMZN came under pressure, with volatility increasing into early 2026 amid broader tariff-related market concerns and company-specific cost pressures. The stock then fell to a low of $197.85 on 5 February 2026 after Q4 2025 earnings, before stabilising and moving back above $200 in the weeks that followed.
AMZN closed at $216.25 on 18 March 2026, approximately 12.5% below its November 2025 peak. That leaves the share price modestly below its 1 January 2026 open of $237.24, while still above the $193.38 close recorded on 18 March 2025.
Past performance is not a reliable indicator of future results. Share prices are indicative and may differ from live market prices.
Amazon (AMZN): Capital.com analyst view
Amazon's AMZN share price has navigated a turbulent two years, moving from the mid-$170s in early 2024 to an all-time high of $259.06 in November 2025, before retreating sharply to a low of $160.50 in April 2025 amid broad tariff-driven market volatility. The recovery since then has been notable, with AMZN trading back above $216 as of 18 March 2026. A key pillar of that recovery narrative is AWS, where CEO Andy Jassy stated in March 2026 that AI development could push annual AWS revenue toward $600bn by 2036, up from $128.7bn in 2025. However, projections of that magnitude carry significant uncertainty and depend on sustained enterprise AI adoption outpacing competition from Azure and Google Cloud.
On the other side of the ledger, Amazon's retail business faces a more complex backdrop. CEO Jassy acknowledged at Davos in January 2026 that Trump administration tariffs are feeding through to product pricing, with some third-party sellers passing costs on to consumers and others absorbing them. While consumer spending has remained relatively resilient so far, any softening in discretionary demand or further tariff escalation could weigh on retail margins. Meanwhile, the $200bn capital expenditure programme planned for 2026 underpins long-term cloud capacity, but it also pressures near-term free cash flow — a factor reflected in several brokers trimming their price targets in February 2026.
Past performance is not a reliable indicator of future results.
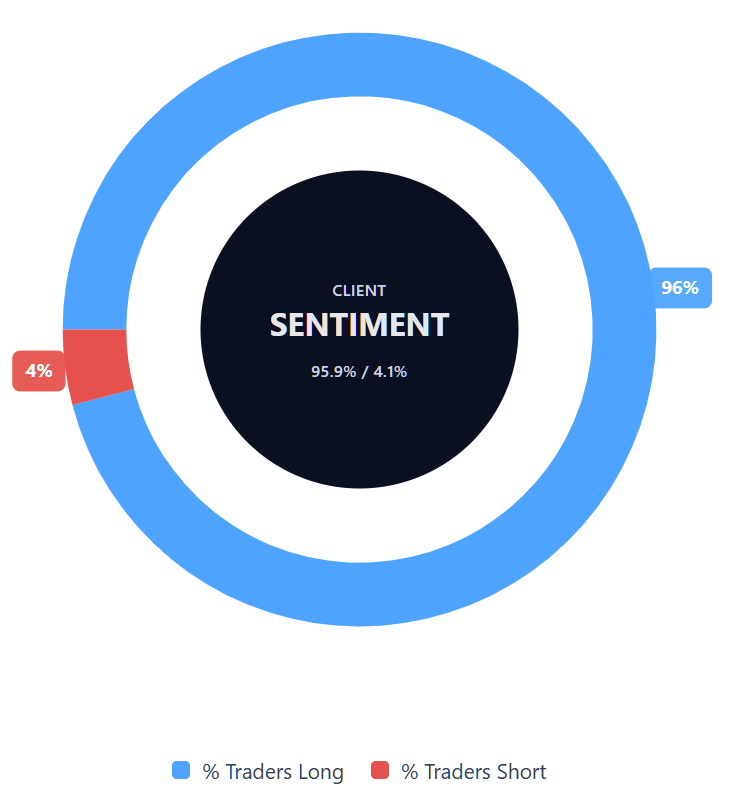
Capital.com’s client sentiment for Amazon CFDs
As of 18 March 2026, Capital.com client positioning in Amazon CFDs is skewed toward longs: 95.9% buyers vs 4.1% sellers, putting buyers ahead by 91.8 percentage points and placing sentiment firmly in heavy-buy, one-sided territory. This snapshot reflects open positions on Capital.com and can change.
Summary – Amazon 2026
- AMZN trades at $216.05 as of 10:35am UTC on 18 March 2026, recovering from a two-year low of $160.50 in April 2025 and remaining well below the November 2025 peak of $259.06.
- Short-term moving averages (20-day SMA at around $211) suggest near-term support, while the 50, 100, and 200-day SMAs all sit above the current price, registering sell signals; the 14-day RSI reads a neutral 51.43.
- Key drivers include AWS AI expansion, with CEO Andy Jassy projecting revenue of up to $600bn by 2036, offset by a $200bn 2026 capital expenditure commitment weighing on near-term free cash flow.
- Tariff pass-through remains a watchpoint, with Jassy acknowledging at Davos in January 2026 that US import tariffs are feeding into product pricing across Amazon's retail marketplace.
- Amazon launched Prime Video Ultra in March 2026, raising the ad-free streaming add-on price from $2.99 to $4.99; analysts note potential subscription revenue upside alongside the risk of weaker demand if customers prove price-sensitive.
Past performance is not a reliable indicator of future results.
FAQ
Who owns the most Amazon stock?
What is the 5 year Amazon share price forecast?
Is Amazon a good stock to buy?
Could Amazon stock go up or down?
Should I invest in Amazon stock?
Can I trade Amazon CFDs on Capital.com?
Yes, you can trade Amazon CFDs on Capital.com. Trading share CFDs lets you speculate on price movements without owning the underlying asset and to take long or short positions. However, contracts for difference (CFDs) are traded on margin, and leverage amplifies both profits and losses. You should ensure you understand how CFD trading works, assess your risk tolerance, and recognise that losses can occur quickly.