Amazon stock forecast: Jassy flags tariff cost pressures
Amazon.com faces tariff-related cost pressures in 2026, after Andy Jassy said in January that higher import costs were starting to feed through to some product prices. Explore third-party AMZN price targets and technical analysis. Past performance is not a reliable indicator of future results.Amazon.com, Inc. (AMZN) last traded around $237.93, within a session intraday range of $231.82–$239.81, as of 4:30pm UTC on 13 April 2026. Past performance is not a reliable indicator of future results.
Price action has been shaped by several concurrent factors: persistent concerns over US trade tariffs, with Amazon CEO Andy Jassy stating in January 2026 at the World Economic Forum in Davos that tariff-driven cost pressures were beginning to 'creep' into product prices as pre-tariff inventory accumulated by third-party sellers was largely depleted by autumn 2025 (Reuters, 20 January 2026); a February 2026 US Supreme Court ruling that struck down a portion of President Trump's import tariffs, which provided a temporary lift to e-commerce stocks including AMZN (CNBC, 20 February 2026); and ongoing speculation, reported by the Financial Times and cited by Yahoo Finance, that the US Department of Commerce was evaluating chip-tariff exemptions for AI hyperscalers such as Amazon, in connection with TSMC investment commitments (Yahoo Finance, 10 February 2026).
Amazon stock forecast 2026–2030: Third-party price targets
As of 13 April 2026, third-party Amazon stock predictions have shifted materially since late March 2026, shaped by evolving views on AWS revenue momentum, the approximately $200 billion 2026 capital expenditure programme, and US trade tariff risks affecting the e-commerce segment.
Wolfe Research (outperform, trimmed target)
Wolfe Research trims its 12-month price target on AMZN to $250 from $255, while retaining an Outperform rating. The firm cites near-term margin uncertainty tied to elevated capital expenditure commitments and a near-record approximately $54 billion bond issuance as the primary headwinds to its revised view (MarketBeat, 19 March 2026).
New Street Research (buy, lowered target)
New Street Research lowers its AMZN price target to $280 from $285, maintaining a Buy rating. The modest reduction reflects tempered near-term AWS margin assumptions, with the firm's constructive longer-term view anchored in AI infrastructure demand and enterprise cloud adoption (MarketScreener, 30 March 2026).
Cantor Fitzgerald (overweight, raised target)
Cantor Fitzgerald raises its AMZN stock forecast to $260 from $250, reiterating an Overweight rating. The firm notes Uber's expanded adoption of AWS Graviton and a Trainium3 chip trial as evidence of broadening commercial traction, while a logistics agreement with the US Postal Service covering roughly 80% of current package volume removes a near-term operational risk (GuruFocus, 8 April 2026).
Wells Fargo (overweight, raised target)
Wells Fargo lifts its AMZN price target to $305 from $304 and maintains an Overweight rating, naming Amazon its top internet pick. The bank cites AWS revenue acceleration and a positive inflection in free cash flow revisions as two supports, while acknowledging near-term tariff exposure in the international retail segment (247 Wall St., 2 April 2026).
MarketBeat (consensus, Moderate Buy)
MarketBeat aggregates ratings from 58 analysts, arriving at a consensus Moderate Buy with an average 12-month price target of $287.39. Targets within the panel span from $175 to $325, with the wide range reflecting differing assumptions on capital expenditure normalisation timelines and the pace of AI infrastructure monetisation (MarketBeat, 8 April 2026).
Predictions and third-party forecasts are inherently uncertain, as they cannot fully account for unexpected market developments. Past performance is not a reliable indicator of future results.
AMZN stock price: Technical overview
The AMZN stock price last closed at $237.93, trading within a session range of $231.82–$239.81 as of 4:30pm UTC on 13 April 2026. On the daily chart, the price remains above its key moving-average cluster of 20-, 50-, 100- and 200-day SMAs, which sit at approximately $214, $213, $223 and $225 respectively. All four moving averages in TradingView's panel signalled a buy alignment as of 13 April 2026.
Momentum readings are mixed at the stretched end of the range: the 14-day relative strength index (RSI) reads 70.55, a level TradingView classifies as a sell signal and one that is consistent with near-term overbought conditions after the recent advance. The average directional index (ADX) at 18.82 sits in neutral territory, suggesting the prevailing trend lacks strong directional conviction.
To the upside, the classic R1 pivot at $219.45 has already been cleared; the R2 level at $230.62 has similarly been exceeded, leaving the R3 area near $251.95 as the next reference on the classic pivot framework. The Hull moving average (9-period) reads $240.69 and sits above the last close, representing a nearby overhead reference.
On pullbacks, the classic pivot point at $209.29 offers initial support, followed by the 100-day SMA shelf near $222.86 as the more substantial moving-average reference. A retreat towards S1 at $198.12 would represent the next downside level on the classic pivot model if the pivot point gives way (TradingView, 13 April 2026).
This is technical analysis for informational purposes only and does not constitute financial advice or a recommendation to buy or sell any instrument.
Amazon share price history (2024–2026)
AMZN’s stock price opened April 2024 trading around $183, having recovered steadily from a bruising 2022–2023 period. The stock edged higher through mid-2024, briefly touching $201 in early July before pulling back. It then staged a sharper rally through the autumn, crossing $230 for the first time since early 2022 by November 2024.
That momentum carried into early 2025, with AMZN reaching an intraday high of $252.56 on 12 November 2025 – the peak across the two-year window. From there, however, the picture changed. A steep sell-off unfolded through April 2025 amid tariff-driven market volatility, dragging the stock to an intraday low of $160.50 on 7 April 2025 – the weakest point in the dataset. A partial recovery followed through May, with prices clawing back towards $210 by late May 2025.
AMZN then largely traded sideways across the summer of 2025, oscillating in the $215–$240 corridor. A brief push above $247 in early January 2026 gave way to renewed selling pressure, with the stock shedding ground through February and March 2026 and touching lows around $196 in mid-February. A recovery through late March and into April has since lifted the share price back above $230.
AMZN closed at $238.03 on 13 April 2026, approximately 8.1% higher year on year, based on the 13 April 2025 close of $185.15 , though that date fell during the sharpest phase of the April 2025 sell-off, which flatters the year-on-year comparison.
Past performance is not a reliable indicator of future results. Share prices are indicative and may differ from live market prices.
Amazon (AMZN): Capital.com analyst view
Amazon.com's price action over the past two years reflects the pull between two forces: structural growth in its cloud and advertising businesses, and mounting investor concern about the cost and timeline of its AI infrastructure build-out. AWS revenue grew 24% year on year to $35.6 billion in Q4 2025, according to Reuters, underscoring the strength of underlying cloud demand. However, the company's announcement of approximately $200 billion in capital expenditure for 2026 sent shares down roughly 10% in a single session in early February, as market participants questioned whether those outlays would translate into proportional returns within a reasonable timeframe (Reuters, 5 February 2026).
On the macro side, US trade tariffs present a similarly two-sided picture. A prolonged tariff dispute could compress margins in Amazon's retail segment and weigh on third-party seller volumes, as noted by analysts cited by RoboForex in February 2026. At the same time, Amazon's scale and logistics infrastructure may offer relative resilience compared with smaller e-commerce peers. The broader question heading into the second half of 2026 is whether AWS growth reaccelerates sufficiently to offset free cash flow pressure . That outcome could support sentiment, while slower-than-expected AI monetisation could weigh on it.
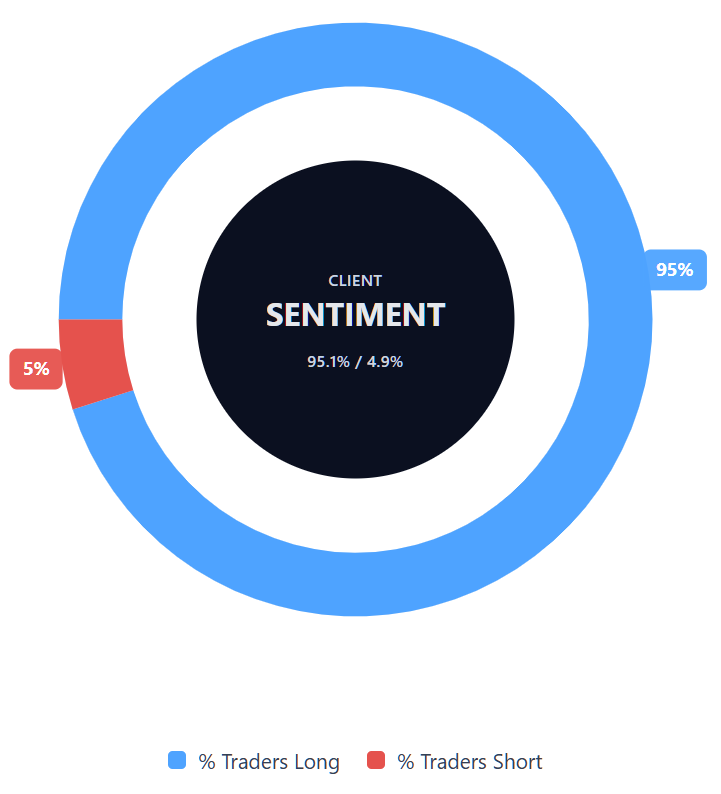
Capital.com’s client sentiment for Amazon CFDs
As of 13 April 2026, Capital.com client positioning in Amazon CFDs shows that 95.1% of open positions are buyers versus 4.9% sellers, putting buyers ahead by 90.2 percentage points and placing sentiment firmly in heavy-buy, one-sided-towards-longs territory. This snapshot reflects open positions on Capital.com at the time of writing and can change rapidly as market conditions evolve.
Summary – Amazon 2026
- AMZN last traded at $237.93, within a session range of $231.82–$239.81, recovering from an April 2025 low of $160.50 and a February 2026 trough near $196, as of 4:30pm UTC on 13 April 2026.
- Key price drivers include AWS cloud growth, Amazon's approximately $200 billion 2026 capital expenditure programme, and ongoing US trade tariff pressures on its retail and third-party seller segments.
- CEO Andy Jassy noted in January 2026 that tariffs were beginning to push product prices higher; a February 2026 Supreme Court ruling partially struck down Trump tariffs, providing a temporary lift to e-commerce stocks including AMZN.
Past performance is not a reliable indicator of future results.
FAQ
Who owns the most Amazon.com stock?
What is the 5 year Amazon.com share price forecast?
Is Amazon.com a good stock to buy?
Could Amazon.com stock go up or down?
Should I invest in Amazon.com stock?
Can I trade Amazon.com CFDs on Capital.com?
Yes, you can trade Amazon CFDs on Capital.com. Trading share CFDs lets you speculate on price movements without owning the underlying asset and to take long or short positions. However, contracts for difference (CFDs) are traded on margin, and leverage amplifies both profits and losses. You should ensure you understand how CFD trading works, assess your risk tolerance, and recognise that losses can occur quickly.