Alphabet stock forecast: Ceasefire hopes, DOJ appeal
Alphabet is navigating a mixed backdrop, with GOOG under pressure from higher 2026 capital spending and the DOJ’s search antitrust appeal, even as broader market sentiment has improved. Past performance is not a reliable indicator of future results.
Explore third-party GOOG price targets and technical analysis.
Alphabet Inc (GOOG) is trading at $290.06 as of 12:45pm UTC on 1 April 2026, within an intraday range of $271.45–$290.45 on Capital.com's quote feed. Past performance is not a reliable indicator of future results.
Sentiment has improved after Iran signalled a willingness to pursue a ceasefire with the United States, sparking the S&P 500's strongest single-session gain since May on Tuesday – the index climbed 2.9% to 6,528.5 – while oil prices retreated and U.S. equity futures extended gains into Wednesday's session (Bloomberg, 31 March 2026). The move follows a period of acute selling pressure for GOOG, which fell nearly 9% in the week ending 27 March 2026 amid broader technology-sector weakness tied to geopolitical uncertainty and concerns over the company's elevated 2026 capital expenditure guidance of $175–$185bn, roughly doubling year on year (CNBC, 27 March 2026). The DOJ's ongoing appeal in the Google search antitrust case, filed in February 2026, remains a structural overhang for the stock (Reuters, 3 February 2026).
Alphabet stock forecast 2026–2030: Third-party price targets
As of 1 April 2026, third-party Alphabet stock predictions reflect broadly constructive views despite the stock's near-20% drawdown from its February 2026 peak, with house targets ranging from $310 to $420 and consensus aggregates clustering in the high-$360s to low-$380s.
Watcher Guru (April 2026 technical outlook)
Watcher Guru projects a recovery range of $310–$315 for GOOG in April 2026, noting the 14-day RSI at 18.2 – a reading the publication characterises as heavily oversold – and the 200-day SMA near $263 as primary support. The note cites the Q1 2026 earnings announcement scheduled for 23 April as a near-term catalyst for a potential institutional buying response (Watcher Guru, 30 March 2026).
Needham (Buy reiteration)
Needham analyst Laura Martin reiterated a Buy rating and $400 price target on GOOG, reaffirming a position first established when the firm lifted its target from $330 following Q4 2024 results. The firm argues Alphabet will self-fund 100% of its capital expenditure between fiscal year 2025 and fiscal year 2028 from free cash flow, citing levered free cash flow of $73.3bn over the last 12 months and a return on invested capital of 26% (Investing.com, 13 March 2026).
Wells Fargo (Overweight, target raised)
Wells Fargo analyst Ken Gawrelski raised his 12-month price target on Alphabet to $397 from $387, maintaining an Overweight rating even as shares fell 8.9% that week. The revision reflects the firm's view that GOOG remains well placed to emerge as an AI leader, with the analyst noting in a client note that the stock has meaningful room to recover (MarketScreener, 27 March 2026).
Barchart (consensus and valuation overview)
Barchart reported that 68 analysts surveyed by Yahoo Finance held an average 12-month price target of $359.53 for GOOG, with Barchart's own analyst survey placing the aggregate at $379.21, and at least one analyst maintaining the Street's highest target at $420. The piece highlights strong operating cash flow as the basis for value-based estimates, noting that the $377 intrinsic value calculation it presents suggests potential upside of more than 30% from the prevailing price at the time of writing (Barchart, 22 March 2026).
MarketBeat (broker consensus)
MarketBeat aggregated ratings from 51 brokerages, recording a Moderate Buy consensus with an average 12-month price target of $368.06, drawn from 44 Buy ratings, 3 Strong Buy ratings, and 4 Hold ratings, with no Sell ratings. The report notes that the consensus target sits within a range anchored at the low end by Cantor Fitzgerald's $171 and at the high end by Pivotal Research's $420 (MarketBeat, 31 March 2026).
Predictions and third-party forecasts are inherently uncertain, as they cannot fully account for unexpected market developments. Past performance is not a reliable indicator of future results.
GOOG stock price: Technical overview
The GOOG stock price is trading at $290.06 as of 12:45pm UTC on 1 April 2026, sitting just below the classic pivot at $319.49 and beneath a stacked moving-average band where the 20-, 50- and 100-day SMAs run at approximately $297, $311 and $311 respectively – all of which register sell signals on TradingView. The 200-day SMA at $264 and the 200-day EMA at $272 remain below the current price and still show buy signals, suggesting that longer-term trend support is still intact even as near-term structure has deteriorated.
The 14-day RSI reads 40.24 – a lower-neutral reading that does not indicate oversold conditions but also shows no momentum recovery underway. The average directional index at 33.43 indicates that an established directional trend is in force, consistent with the prevailing sell alignment across shorter-duration moving averages. The MACD level at −8.28 registers a sell signal, while the stochastic %K at 14.63 reads as a buy, illustrating a mixed short-term oscillator picture.
On the topside, the classic pivot at $319.49 is the first reference point; a daily close above this level could put R1 at $342.09 in view. On the downside, S1 at $288.84 is the nearest classical support level, with the 200-day EMA near $272 and the Hull moving average at $272.42 forming a potential longer-term shelf beneath (TradingView, 1 April 2026).
This is technical analysis for informational purposes only and does not constitute financial advice or a recommendation to buy or sell any instrument.
Alphabet share price history (2024–2026)
GOOG’s stock price has had an eventful two years, rising sharply before pulling back hard in early 2026.
The stock opened April 2024 at around $157, remaining largely rangebound through the first half of the year as it consolidated gains from 2023. A brief but dramatic dip to a low of $153.25 on 25 April 2024 – tied to a wider earnings-week swing – quickly reversed, and GOOG climbed steadily through the second half of 2024, closing the year at $191.04 on 31 December 2024.
2025 built on that momentum. GOOG began the year near $190, grinding higher through the spring, and accelerated meaningfully in the autumn, clearing $250 by mid-October 2025 and pushing above $326 by late November. The stock closed 2025 at $313.93, up roughly 64% from its April 2024 lows.
The rally extended into early 2026, with GOOG reaching a two-year high close of $350.33 on 3 February 2026, buoyed by strong Q4 2025 results. From there, however, the stock retreated sharply, falling below $275 by late March 2026 amid broader technology-sector selling pressure and geopolitical uncertainty.
GOOG closed at $290.35 on 1 April 2026, approximately 7.5% down year to date and roughly 17% below its February 2026 peak.
Past performance is not a reliable indicator of future results. Share prices are indicative and may differ from live market prices.
Alphabet (GOOG): Capital.com analyst view
Alphabet's GOOG has delivered meaningful gains over the past two years, climbing from around $157 in April 2024 to a two-year closing high of $350.33 in early February 2026 – a move underpinned by strong Q4 2025 earnings, accelerating Google Cloud revenue growth of 34% year on year in Q3 2025, and rising institutional confidence in the company's AI monetisation strategy via Gemini and Vertex AI. The case for continued growth centres on a $155bn cloud backlog and the company's capacity to self-fund capital expenditure from free cash flow. However, those same elevated spending commitments, with 2026 capex guidance of $175–$185bn, raise legitimate questions about near-term margin pressure and return on investment if AI-driven revenue growth disappoints.
Regulatory risk adds a further layer of complexity. The DOJ's ongoing appeal in the Google search antitrust case, combined with a separate EU investigation into AI content practices, could constrain Alphabet's ability to bundle services and monetise search at its current scale. On the other hand, a favourable resolution in either proceeding, as seen when the September 2025 antitrust ruling lifted shares 7% in a single session, illustrates that regulatory outcomes can also act as a meaningful positive catalyst.
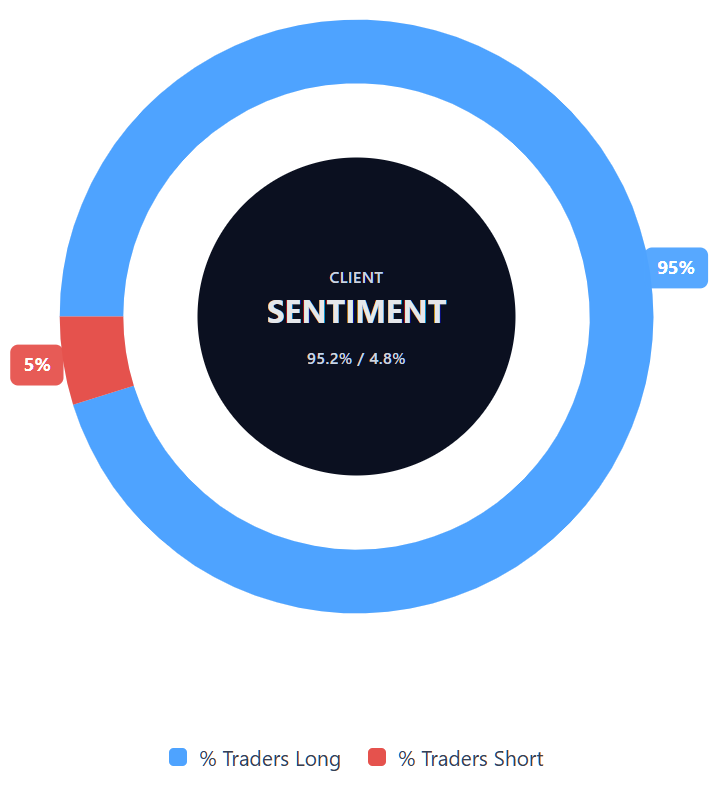
Capital.com’s client sentiment for Alphabet CFDs
As of 1 April 2026, Capital.com client positioning in Alphabet CFDs shows 95.2% buyers compared with 4.8% sellers, putting buyers ahead by 90.4 percentage points and placing sentiment firmly in one-sided territory. This snapshot reflects open positions on Capital.com and can change rapidly as market conditions evolve.
Summary – Alphabet 2026
- As of 12:45pm UTC on 1 April 2026, GOOG is trading at $290.06, around 17% below its February 2026 two-year closing high of $350.33.
- Technical indicators lean bearish in the near term, with price sitting below all short- to medium-term SMAs; the 14-day RSI at 40.24 reflects lower-neutral momentum with no confirmed recovery signal.
- Key drivers include Alphabet's elevated 2026 capex guidance of $175–$185bn, Google Cloud's 34% revenue growth, and ongoing AI monetisation efforts via Gemini and Vertex AI.
- Regulatory risk remains a structural overhang, with the DOJ's appeal in the Google search antitrust case filed in February 2026 and a separate EU AI content investigation remaining active.
Past performance is not a reliable indicator of future results.
FAQ
Who owns the most Alphabet stock?
What is the 5 year Alphabet share price forecast?
Is Alphabet a good stock to buy?
Could Alphabet stock go up or down?
Should I invest in Alphabet stock?
Can I trade Alphabet CFDs on Capital.com?
Yes, you can trade Alphabet CFDs on Capital.com. Trading share CFDs lets you speculate on price movements without owning the underlying asset and to take long or short positions. However, contracts for difference (CFDs) are traded on margin, and leverage amplifies both profits and losses. You should ensure you understand how CFD trading works, assess your risk tolerance, and recognise that losses can occur quickly.