Wells Fargo stock forecast: Third-party price targets
Wells Fargo (WFC) is trading at $78.99 as of 3:08pm UTC on 13 October 2025, within an intraday range of $77.33–$80.33.
The stock sits midway through its session’s low and high, reflecting steady consolidation.
Investor focus remains on upcoming bank earnings, as US stock index futures rose after President Trump struck a softer tone on trade, easing concerns over renewed China tariffs (Reuters, 13 October 2025).
Wells Fargo stock forecast: Analyst price target view
Piper Sandler (strategist note)
Piper Sandler set a 12-month price target of $77 on 8 April 2025, reflecting a conservative view on near-term loan growth following the asset cap removal, which allows but delays balance sheet expansion (Investing.com, 13 October 2025).
UBS (CIO commentary)
UBS maintained a one-year price target of $89.13 on 29 September 2025, citing anticipated mid-single-digit EPS growth, stable credit quality and potential operating leverage gains (Nasdaq, 7 October 2025).
Morgan Stanley (equal-weight)
Morgan Stanley raised its WFC target to $95 on 29 September 2025, noting limited near-term upside given current valuations, yet acknowledging scope for improvement from management’s ROTCE initiatives and resumed share buybacks (AInvest, 29 September 2025).
Evercore ISI (analyst note)
Evercore ISI set a $92 12-month price target for WFC on 22 September 2025, highlighting stronger-than-expected deposit growth and cost-control measures supporting earnings resilience despite margin pressures (Nasdaq, 30 September 2025).
Predictions and third-party forecasts are inherently uncertain, as they do not account for unexpected market developments. Past performance is not a reliable indicator of future results.
WFC stock price: Technical overview
On the daily chart, WFC was trading at $78.99 as of 3:08pm UTC on 13 October 2025, holding above its key moving-average cluster – the 20-, 50-, 100- and 200-day MAs at approximately 82, 81, 79 and 76 – with the 20-over-50 alignment remaining intact. Momentum appears neutral, with the 14-day RSI at 39.7, consistent with a sideways bias while the price stays below the moving-average band.
The first area to watch on the upside is the 83.01 pivot; a daily close above this level could bring the 87.5 area into focus.
On pullbacks, initial support lies around 79.37 (S1) and then near the 200-day MA at 76. A break below this area may indicate a further decline towards recent lows (TradingView, 13 October 2025).
This technical analysis is provided for informational purposes only and does not constitute financial advice or a recommendation to buy or sell any instrument.
Wells Fargo share price history
Wells Fargo shares have more than doubled in the past two years, rising from around $41.76 in mid-October 2023 to $80.40 on 7 October 2025. The stock recorded a steady rise through 2024, ending the year at $70.20, before briefly easing to $71.95 in mid-June 2025 amid broader banking-sector weakness. A subsequent recovery saw WFC reach a 52-week high of $84.95 on 26 September 2025, before settling near $80.40 in early October.
Wells Fargo last closed at $80.40 on 7 October 2025, up roughly 14.4% year to date and 42.0% over the past year.
Past performance is not a reliable indicator of future results. Share prices are indicative and may differ from live market prices.
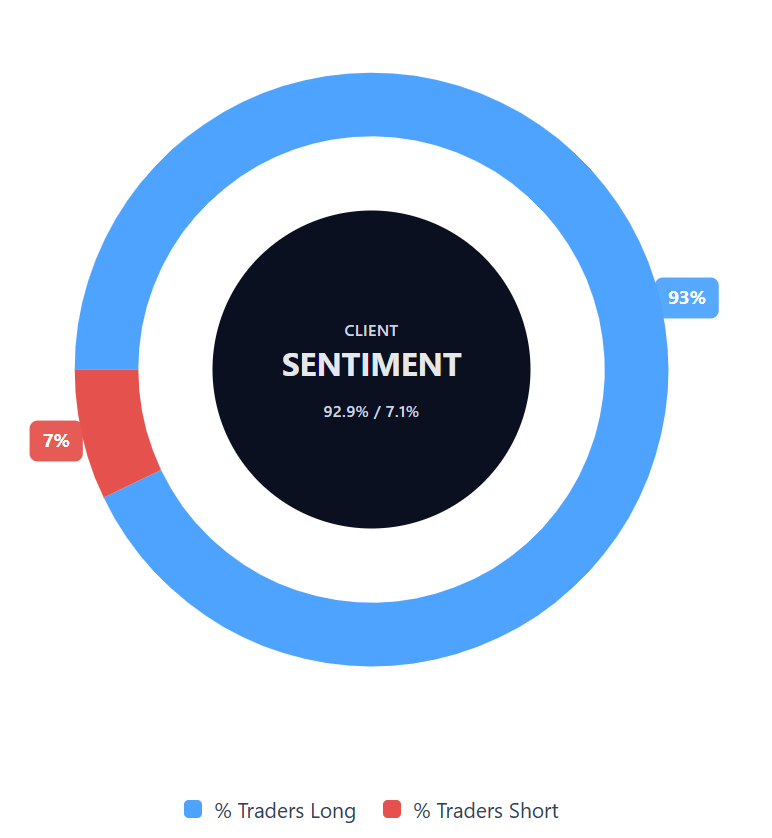
Capital.com’s client sentiment for Wells Fargo CFDs
As of 13 October 2025, Capital.com clients were predominantly long on Wells Fargo CFDs, with 92.9% of positions held by buyers and 7.1% by sellers, leaving buyers ahead by 85.7 percentage points.
This snapshot represents current open positions on Capital.com and is subject to change.
FAQ
Is Wells Fargo a good stock to buy?
Whether Wells Fargo is viewed as a suitable investment depends on individual objectives, risk tolerance, and financial circumstances. Analysts hold mixed views, with price targets reflecting different assumptions about earnings prospects and balance-sheet development. This information is provided for educational purposes only and should not be interpreted as investment advice.
Could Wells Fargo stock go up or down?
Wells Fargo’s share price can fluctuate in response to interest rate trends, credit conditions, earnings announcements, and wider market sentiment. As with all equities, prices may move in either direction depending on prevailing conditions.
Should I invest in Wells Fargo stock?
Capital.com does not provide investment advice. Any decision to invest should be based on independent research, personal financial goals, and an understanding of the associated risks. Always ensure you understand how CFDs work and that you can afford to take the high risk of losing your money. CFDs are traded on margin, and leverage amplifies both profits and losses.