Trading the S&P 500 Following the Greenland Tariff Threat
Equity index takes a hit in the futures market down less than 1% denting short-term technicals, and in sentiment CoT speculators remain net short.
U.S. equity index futures have gapped lower following President Trump’s threat of new tariffs on eight European countries (Germany, France, UK, Denmark, Norway, Sweden, Netherlands and Finland) linked to Greenland negotiations, with an additional 10% starting in February and could reach 25% by June if no agreement is reached regarding “the Complete and Total purchase of Greenland”. It follows a week where the S&P 500 (w/w -0.1% to 6,940), Nasdaq 100 (w/w -0.3% to 25,529), and Dow 30 (w/w -0.3% to 49,359) all posted modest weekly losses with tech leading the declines, while the small-cap Russell 2000 (w/w +2.4% to 2,677) continued to outperform.
Treasury yields rose last Friday as National Economic Council Director Hassett is likely to remain in his current role and not replace Federal Reserve (Fed) Chairman Powell according to President Trump, meaning a candidate that might not advocate as many rates cuts could emerge, and market pricing (CME’s FedWatch) remains not far off fully pricing in a hold out of the Fed later this month, and via majority holding until June.
There were a couple FOMC (Federal Open Market Committee) members speaking, the Fed’s Jefferson signalling a pause on rate changes citing a “cautiously optimistic” outlook and neutral policy stance, while Bowman highlighted labour market risks and the need to remain ready to cut rates if necessary.
As for economic data late last week, it was mixed on Friday with industrial production in December up 0.4% m/m (month-on-month) beating forecasts but NAHB’s housing market index worsening to 37 remaining in negative outlook territory. Thursday’s release of the weekly claims and manufacturing indices easily bested estimates, allaying fears regarding an economic slowdown as the ‘run it hot’ theme persists.
Week ahead
As for the week ahead, there’s a holiday today and mostly low-impacting items in terms of data until Thursday’s PCE (Personal Consumption Expenditures) price index and Q3 GDP (Gross Domestic Product) where a strong 4.3% print is expected for the latter, with preliminary PMIs (Purchasing Managers’ Index) on Friday. You’ve got the World Economic Forum in Davos at a time when geopolitical tensions are worsening with President Trump speaking on Wednesday, and when it comes to Supreme Court opinions we might get the one regarding the legality of IEEPA (International Emergency Economic Powers Act) tariffs tomorrow, else focus will be on Wednesday to see whether he can fire Fed member Cook with implications for Fed Chair Powell amidst the DOJ investigation.
Let’s not forget earnings and from a more diversified bunch after last week’s figures from the financial heavyweights, with Netflix, 3M and some regional banks tomorrow, J&J and Travelers on Wednesday, Visa, P&G and Intel on Thursday, and more regional banks on Friday.
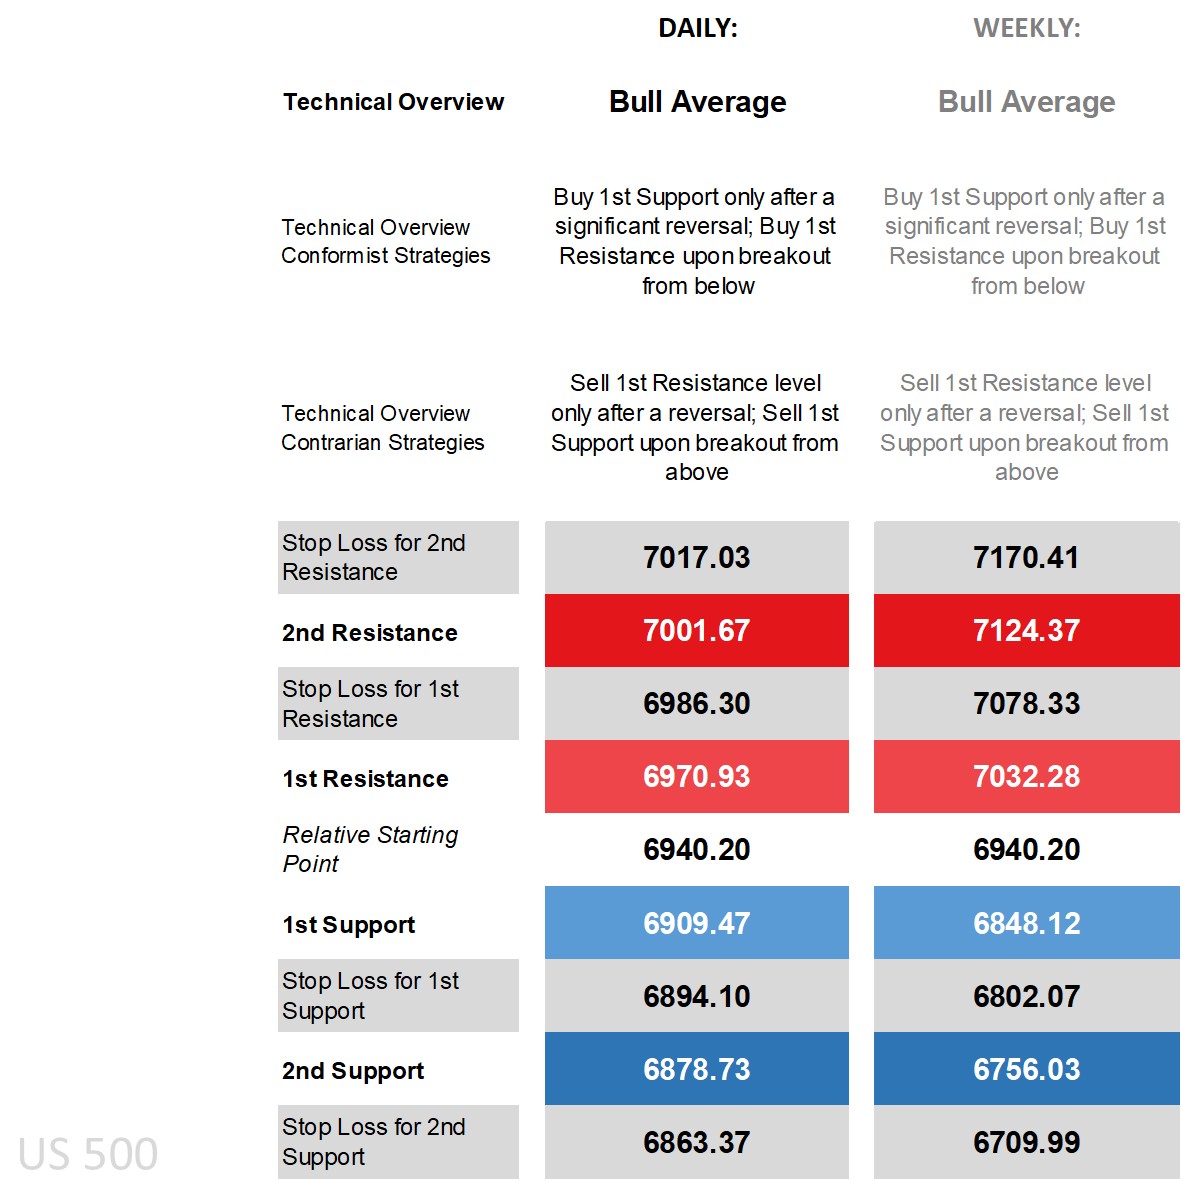
S&P 500’s technical overview, strategies and levels
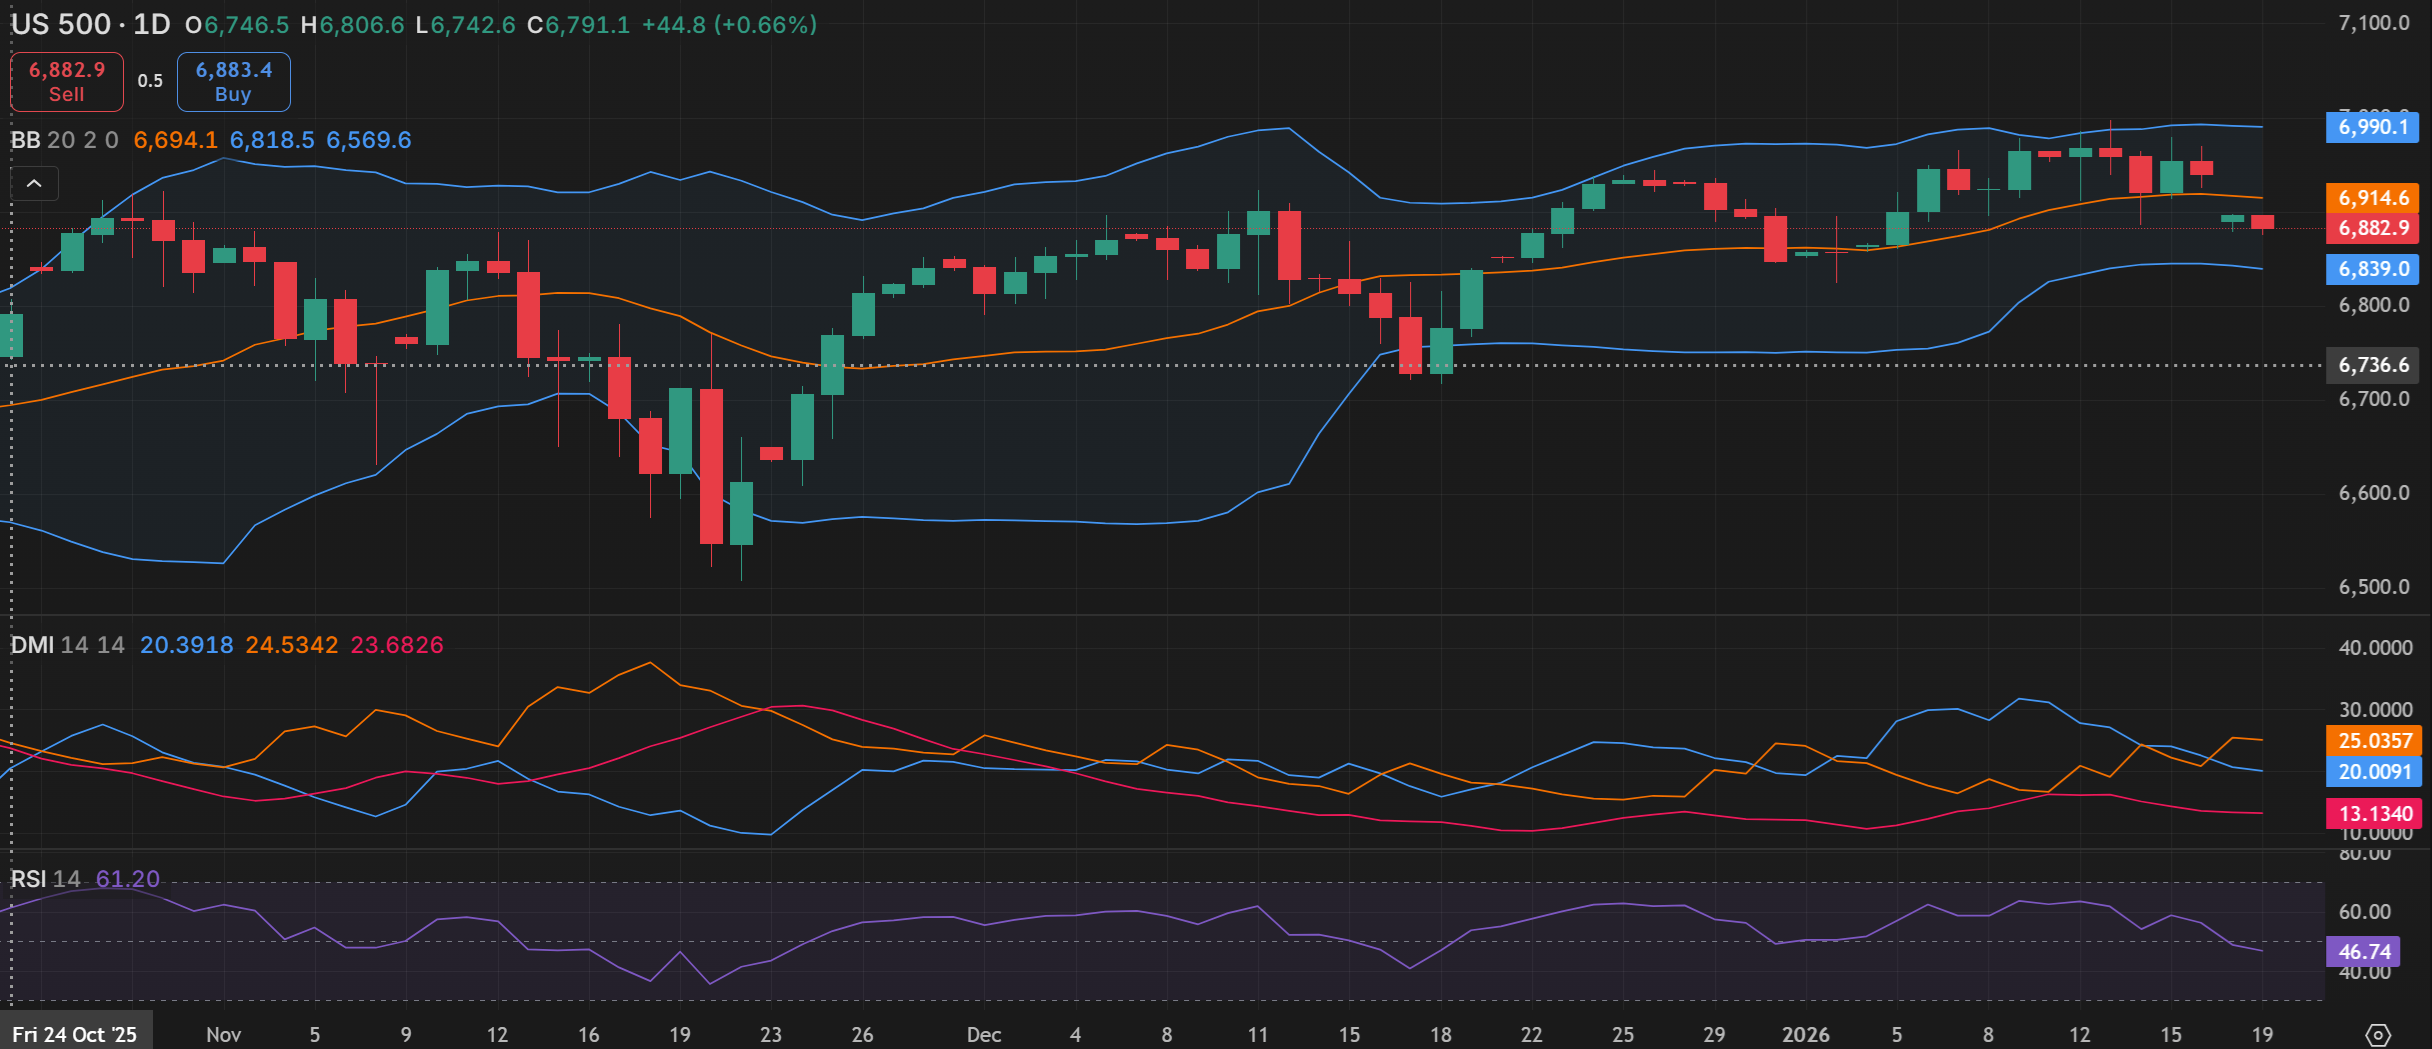
Looking at the daily time frame and price closed above its main long-term moving averages (MA) but has now slid below its main short-term ones and not too far off the lower end of the Bollinger Band, on the DMI (Directional Movement Index) front the -DI crossing below the +DI thanks to the gap lower though it isn’t a large enough margin to label it as negative, an RSI (Relative Strength Index) below 50 but well above oversold levels, and an ADX (Average Directional Movement Index) in non-trending territory. That usually makes for a more ‘cautious consolidation’ technical overview, but owing to longer-term technical bias has kept it ‘bull average’ borrowing heavily off the weekly time frame’s overview.
That means buy strategies are in the conformist camp though with added caution only via significant reversal when doing so off the 1st Support level be it the daily or weekly, with today’s gap lower already reaching the daily 2nd Support while yet to reach the weekly 1st Support level. Contrarians who see the recent moves as the top and expect oscillations or moves to the downside whether from technicals or the fundamental event are armed with sell strategies be it with a sell-breakout off the 1st Support (but only after its recovery since it’s already beneath) or via reversal off the 1st Resistance waiting for the level to be breached and only initiating if price goes back down.
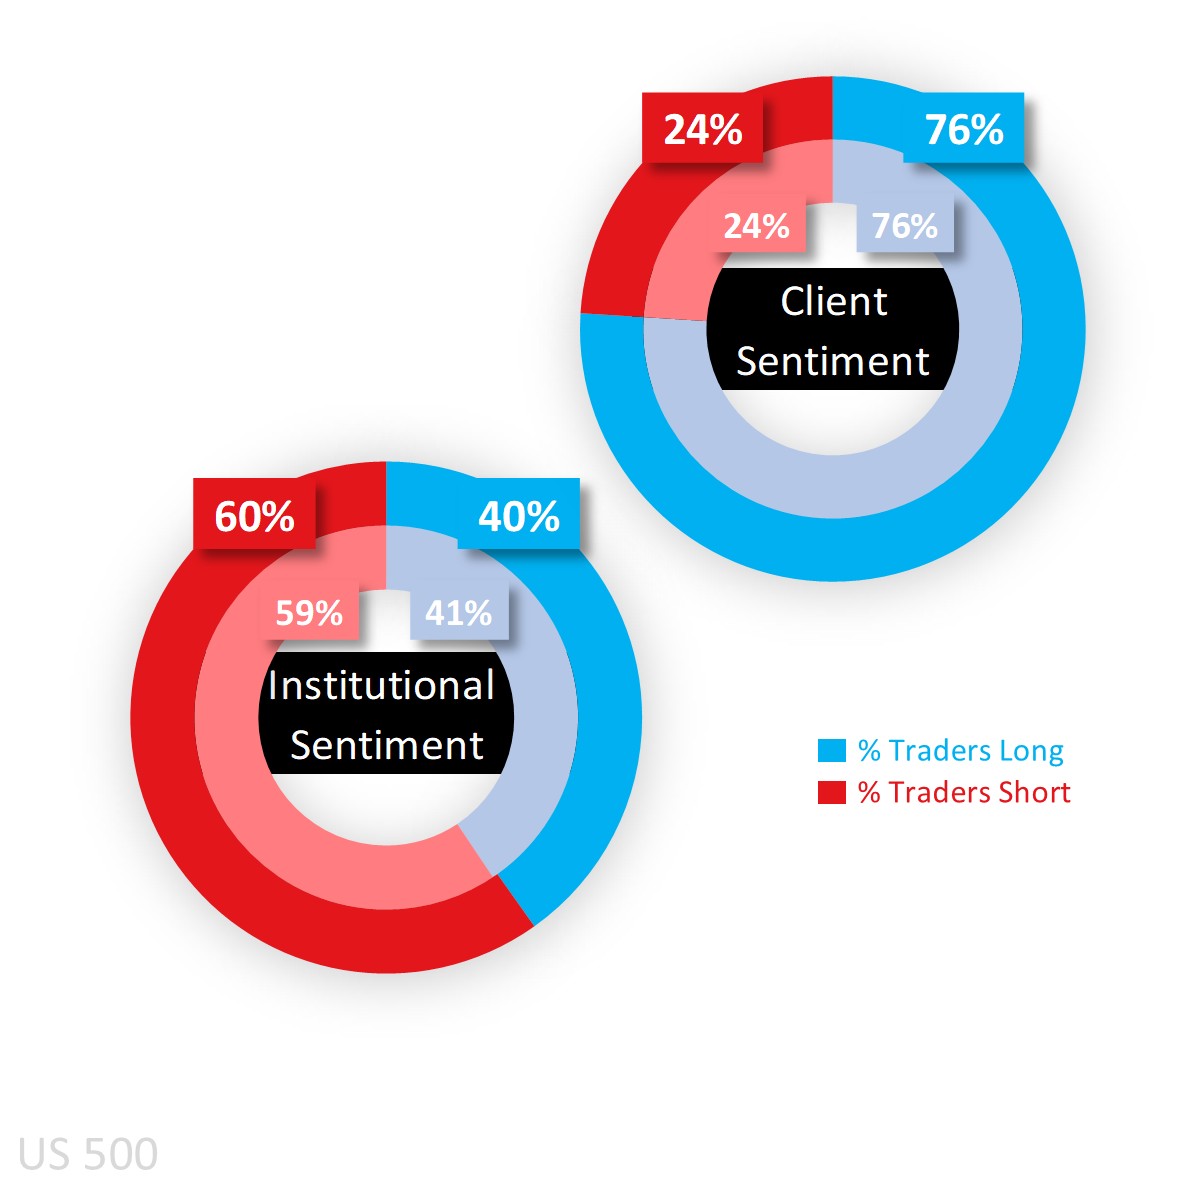
Capital.com’s client sentiment for S&P 500
Client sentiment was and remains very much in heavy buy territory, rising from 71% at the start of last week to 76% and reaching extreme buy 78% as of writing this morning as some fresh shorts closed out following the gap lower.
CoT (Commitment of Traders) speculators are an opposite net short (though a chunk of it has to do with those who are hedging their exposure using the most popular equity index as a measure of the overall market), raising it a notch to 60% according to the latest report out of the CFTC, and is due to a larger increase in shorts (by 35,294 lots) over the increase in longs (by 19,420). For the remaining key U.S. equity indices, they remain net long in the tech-heavy Nasdaq 100 (59% from 61%), barely so in the Dow 30 (just 51% from a net long 58%), and shifted in the Russell 2000 from a net short 51% to a net long 54%.
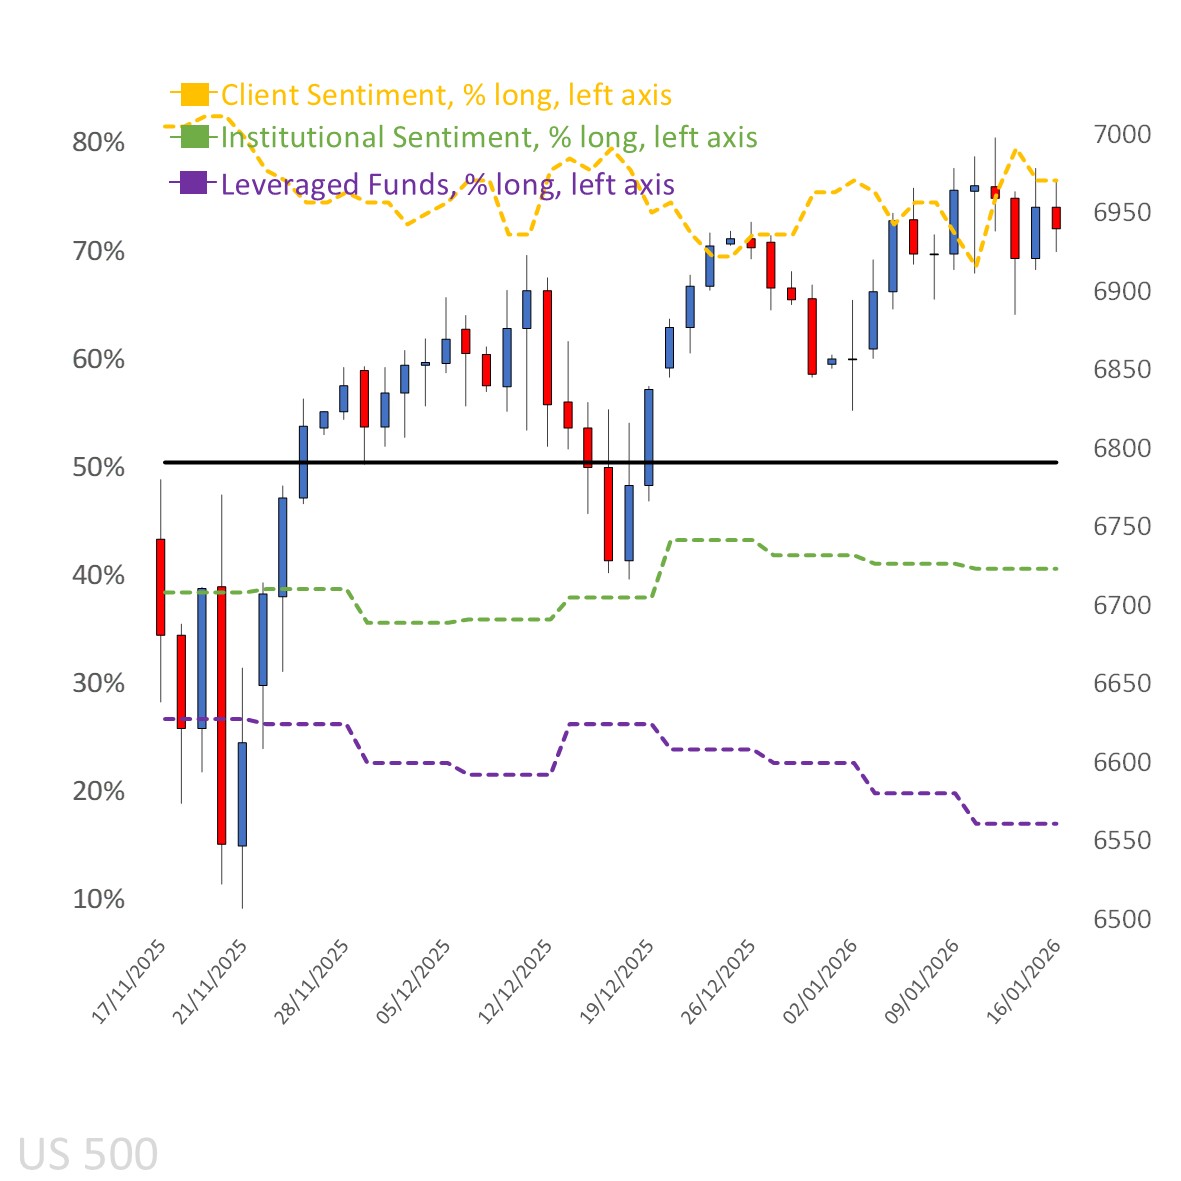
Client sentiment mapped on the daily chart
 Source: Capital.com
Period: NOVEMBER 2025 – JANUARY 2026
Past performance is not an indicator of future results.
S&P 500’s chart on Capital.com’s platform with key technical indicators
Source: Capital.com
Period: OCTOBER 2025 – JANUARY 2026
Past performance is not an indicator of future results.