Prysmian stock forecast: Third-party price targets
Prysmian is a global cables and systems manufacturer listed in Italy, with its share price shaped by earnings results, infrastructure activity and broader European market conditions. Explore PRY price action, third-party price targets and technical analysis.
Prysmian S.p.A. (PRY) is trading around €94.78 in intraday action on 16 January 2026 at 4:04pm UTC, within a session range of approximately €90.98–€95.04 on Capital.com’s quote feed. Past performance is not a reliable indicator of future results.
The move comes amid relatively firm conditions in Italian and broader European equities. Italy’s FTSE MIB has recently been supported by gains in Prysmian and other large-cap names, while the pan-European STOXX 600 has been trading close to record levels in early 2026 (Reuters, 5 January 2026). Recent coverage has also highlighted Prysmian’s outperformance over the past five years and a strong start to 2026 (Investing.com, 30 October 2025)
Prysmian stock forecast 2026–2030: Third-party price targets
As of 16 January 2026, third-party Prysmian stock predictions reflect a wide range of views on the stock’s 12-month and medium-term outlook. The summaries below highlight selected third-party forecasts and their stated drivers. These represent independent opinions, not guarantees, and may change without notice.
Simply Wall St (analyst aggregation)
Simply Wall St reports that the consolidated analyst price target for Prysmian has been raised by about 7.8% to roughly €85.33 over the next year, based on coverage it tracks for the PRY listing. The service notes that its forecast set reflects expectations for earnings growth and sector conditions, linked to ongoing investment trends in energy and telecoms infrastructure (Simply Wall St, 12 January 2026).
Investing.com (analyst poll)
Investing.com’s PRY stock forecast consensus page shows an average 12-month price target drawn from a poll of around 19 analysts, with an average around €92.97, a high estimate of €105 and a low of €42. The platform explains that these figures are compiled from broker research and linked to expectations for revenue trends and sector dynamics, set against broader European equity conditions (Investing.com, 16 January 2026).
Fintel (US-listed line, PRYMF)
Fintel reports that, for the US over-the-counter line PRYMF, the average one-year price target is around $109.95, with forecasts ranging from $50.47 to $131.16. The platform notes that this spread reflects differing analyst views on profitability and sector outlook, alongside varying assessments of risk (Fintel, 16 January 2026).
Predictions and third-party forecasts are inherently uncertain, as they cannot fully account for unexpected market developments. Past performance is not a reliable indicator of future results.
PRY stock price: Technical overview
The PRY stock price is around €94.78 as of 4:04pm UTC on 16 January 2026, holding above a rising cluster of daily moving averages. The 20-, 50-, 100- and 200-day simple moving averages sit around €88, €86, €85 and €71 respectively. The 14-day RSI reads close to 66.6, placing it in an upper-neutral zone, while an ADX near 17.5 suggests a trend that is present but not strongly directional.
On the topside, the nearest classic intraday resistance lies at the R1 level around €88.38, with R2 near €90.35 potentially relevant on a sustained daily close above the first pivot. On pullbacks, the classic pivot near €84.88 marks the first support of note, with the 100-day SMA around €84.58 forming a nearby technical shelf. A break below this area could open a move towards the S1 region near €82.89 (TradingView, 16 January 2026).
This technical analysis is provided for information only and does not constitute financial advice or a recommendation to trade.
Prysmian share price history (2024–2026)
Prysmian’s share price has risen sharply over the past two years, moving from around €40–€42 in early 2024 to the mid-€60s by January 2025. This advance unfolded gradually, with steady gains replacing the tighter trading ranges seen earlier in the period. Throughout 2024, the stock largely traded within a €40–€65 band, posting higher lows and showing relatively contained volatility compared with some other industrial names, which helped establish a base for the subsequent move higher.
Momentum accelerated in 2025, with PRY advancing from the low-€60s in January to above €70 by mid-year, before extending towards €80–€90 into the autumn and breaking into the €90s by late December. By 16 January 2026, the share price had settled near €95.06, meaning it had more than doubled from early-2024 levels. This reflects a strong two-year performance, coinciding with improving sentiment towards infrastructure-linked stocks.
Past performance is not a reliable indicator of future results. Share prices are indicative and may differ from live market prices.
Prysmian (PRY): Capital.com analyst view
The PRY stock price has undergone a notable re-rating over the past two years, rising from the low-€40s in early 2024 to trade in the mid-€90s by mid-January 2026. The latest intraday quote on Capital.com stood near €94.78 at 4:04pm UTC on 16 January 2026. This move has coincided with more constructive sentiment around infrastructure and electrification themes, alongside company-specific news flow and earnings updates. However, the advance has also included periods of consolidation and pullbacks, with prices at times retreating towards earlier support levels.
Looking ahead, Prysmian’s price may continue to respond to factors such as project awards, capital expenditure cycles, interest-rate expectations and broader movements in European equities. These influences could support the stock if conditions remain favourable or weigh on it if growth expectations or risk appetite soften. Positive operational updates or stronger backlog visibility may underpin demand, while margin pressure, project delays or a broader market downturn could increase volatility.
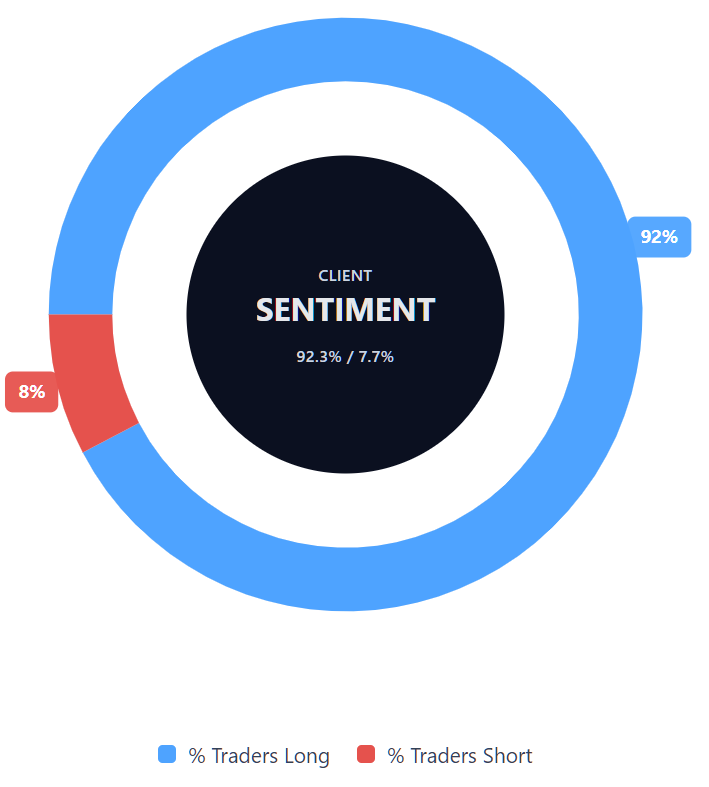
Capital.com’s client sentiment for Prysmian CFDs
As of 16 January 2026, Capital.com client positioning in Prysmian CFDs shows 92.3% buyers versus 7.7% sellers, indicating a heavily skewed tilt towards long positions and a net difference of roughly 84.6 percentage points. This snapshot reflects open CFD positions on Capital.com and may change over time as traders adjust their exposure.
Summary – Prysmian 2026
- Prysmian (PRY) traded around €94.78 on 16 January 2026 at 4:04pm UTC, within an intraday range of approximately €90.98–€95.04 on Capital.com’s feed.
- Over the past two years, the share price has increased from the low-€40s in early 2024 to the mid-€90s, more than doubling over that period.
- Daily technical indicators show the price holding above clustered 20-, 50-, 100- and 200-day moving averages, spanning the mid-€80s to low-€70s, with the 14-day RSI near 66.6.
- Third-party analyst targets compiled across several platforms span a wide range, from the mid-€30s to above €100 over a 12-month horizon, illustrating divergent views on valuation and growth assumptions.
- Prysmian’s future price path may be influenced by project developments, earnings trends and broader European equity conditions, and remains exposed to both upside and downside risks.
Past performance is not a reliable indicator of future results.
FAQ
Who owns the most Prysmian stock?
Prysmian has a widely distributed shareholder base, with ownership spread across institutional investors, asset managers and retail shareholders. Large European and global investment funds typically hold significant stakes, reflecting Prysmian’s inclusion in major indices such as the FTSE MIB and broader STOXX Europe benchmarks. No single shareholder is generally reported as having outright control, and ownership levels can change over time as institutions rebalance their portfolios.
What is the five-year Prysmian share price forecast?
There is no single agreed five-year PRY stock forecast, as longer-term projections vary widely and depend on assumptions around earnings, capital expenditure, infrastructure spending and broader market conditions. Most published forecasts focus on shorter horizons, typically around 12 months. Longer-term outcomes remain uncertain and may be influenced by economic cycles, sector demand and company-specific developments, all of which can evolve materially over time.
Is Prysmian a good stock to buy?
Whether Prysmian is considered a 'good' stock depends on individual objectives, risk tolerance and market outlook. Analysts often reference factors such as earnings trends, infrastructure exposure and balance-sheet strength, while also noting risks linked to project timing, margins and broader equity conditions. Share prices can fluctuate significantly, particularly for single stocks, and past performance does not indicate future results. This content is provided for information only and does not constitute investment advice.
Could Prysmian stock go up or down?
Prysmian’s share price can move in either direction and is influenced by a range of factors, including earnings results, order intake, capital expenditure cycles and wider market sentiment. Positive operational updates or supportive equity conditions may contribute to price gains, while weaker data, project delays or broader market sell-offs could weigh on the stock. As with all equities, price movements can be volatile and unpredictable, especially over shorter timeframes.
Should I invest in Prysmian stock?
Deciding whether to invest in Prysmian is a personal decision that depends on your financial situation, investment goals and risk appetite. Equity investments carry the risk of loss, and share prices can be affected by both company-specific and macroeconomic factors. Before making any investment decision, it’s important to consider the risks involved and, where appropriate, seek independent professional advice. Nothing here should be taken as a recommendation to invest.
Can I trade Prysmian CFDs on Capital.com?
Yes, you can trade Prysmian CFDs on Capital.com. Trading share CFDs lets you speculate on price movements without owning the underlying asset and to take long or short positions. However, contracts for difference (CFDs) are traded on margin, and leverage amplifies both profits and losses. You should ensure you understand how CFD trading works, assess your risk tolerance, and recognise that losses can occur quickly.