Tech Weakness and Rising Yields Rattle Markets
The week of 15 December will be a significant test for global markets following a tough end to US trading on 12 December, when technology shares declined.
The week of 15 December will be a significant test for global markets following a tough end to US trading on 12 December, when technology shares declined. Additionally, central bank policy meetings this week could begin to influence the outlook for global growth and monetary policy in 2026.

Nasdaq Slumps
Stocks fell sharply on Friday, 12 December, with the Nasdaq 100 declining by almost 2%. The sell-off was driven by Broadcom's shares, which dropped sharply after weak margin guidance, compounded by Oracle’s weak free cash flow and CapEx guidance earlier in the week. This put pressure on technology stocks, particularly on the Nasdaq 100, which failed to push through the 78.6% retracement level.
The index dropped below support at 29,400 and is now resting near a support zone around 25,200. Momentum and trend in the Nasdaq appear significantly weaker than in some other indices, such as the S&P 500, suggesting that the Nasdaq may continue to decline toward technical support at 24,550, if the current support at 25,200 fails to hold.
Likewise, if the Nasdaq can recover quickly on Monday, we could see a move to fill the gap at 25,700, which would not be unusual.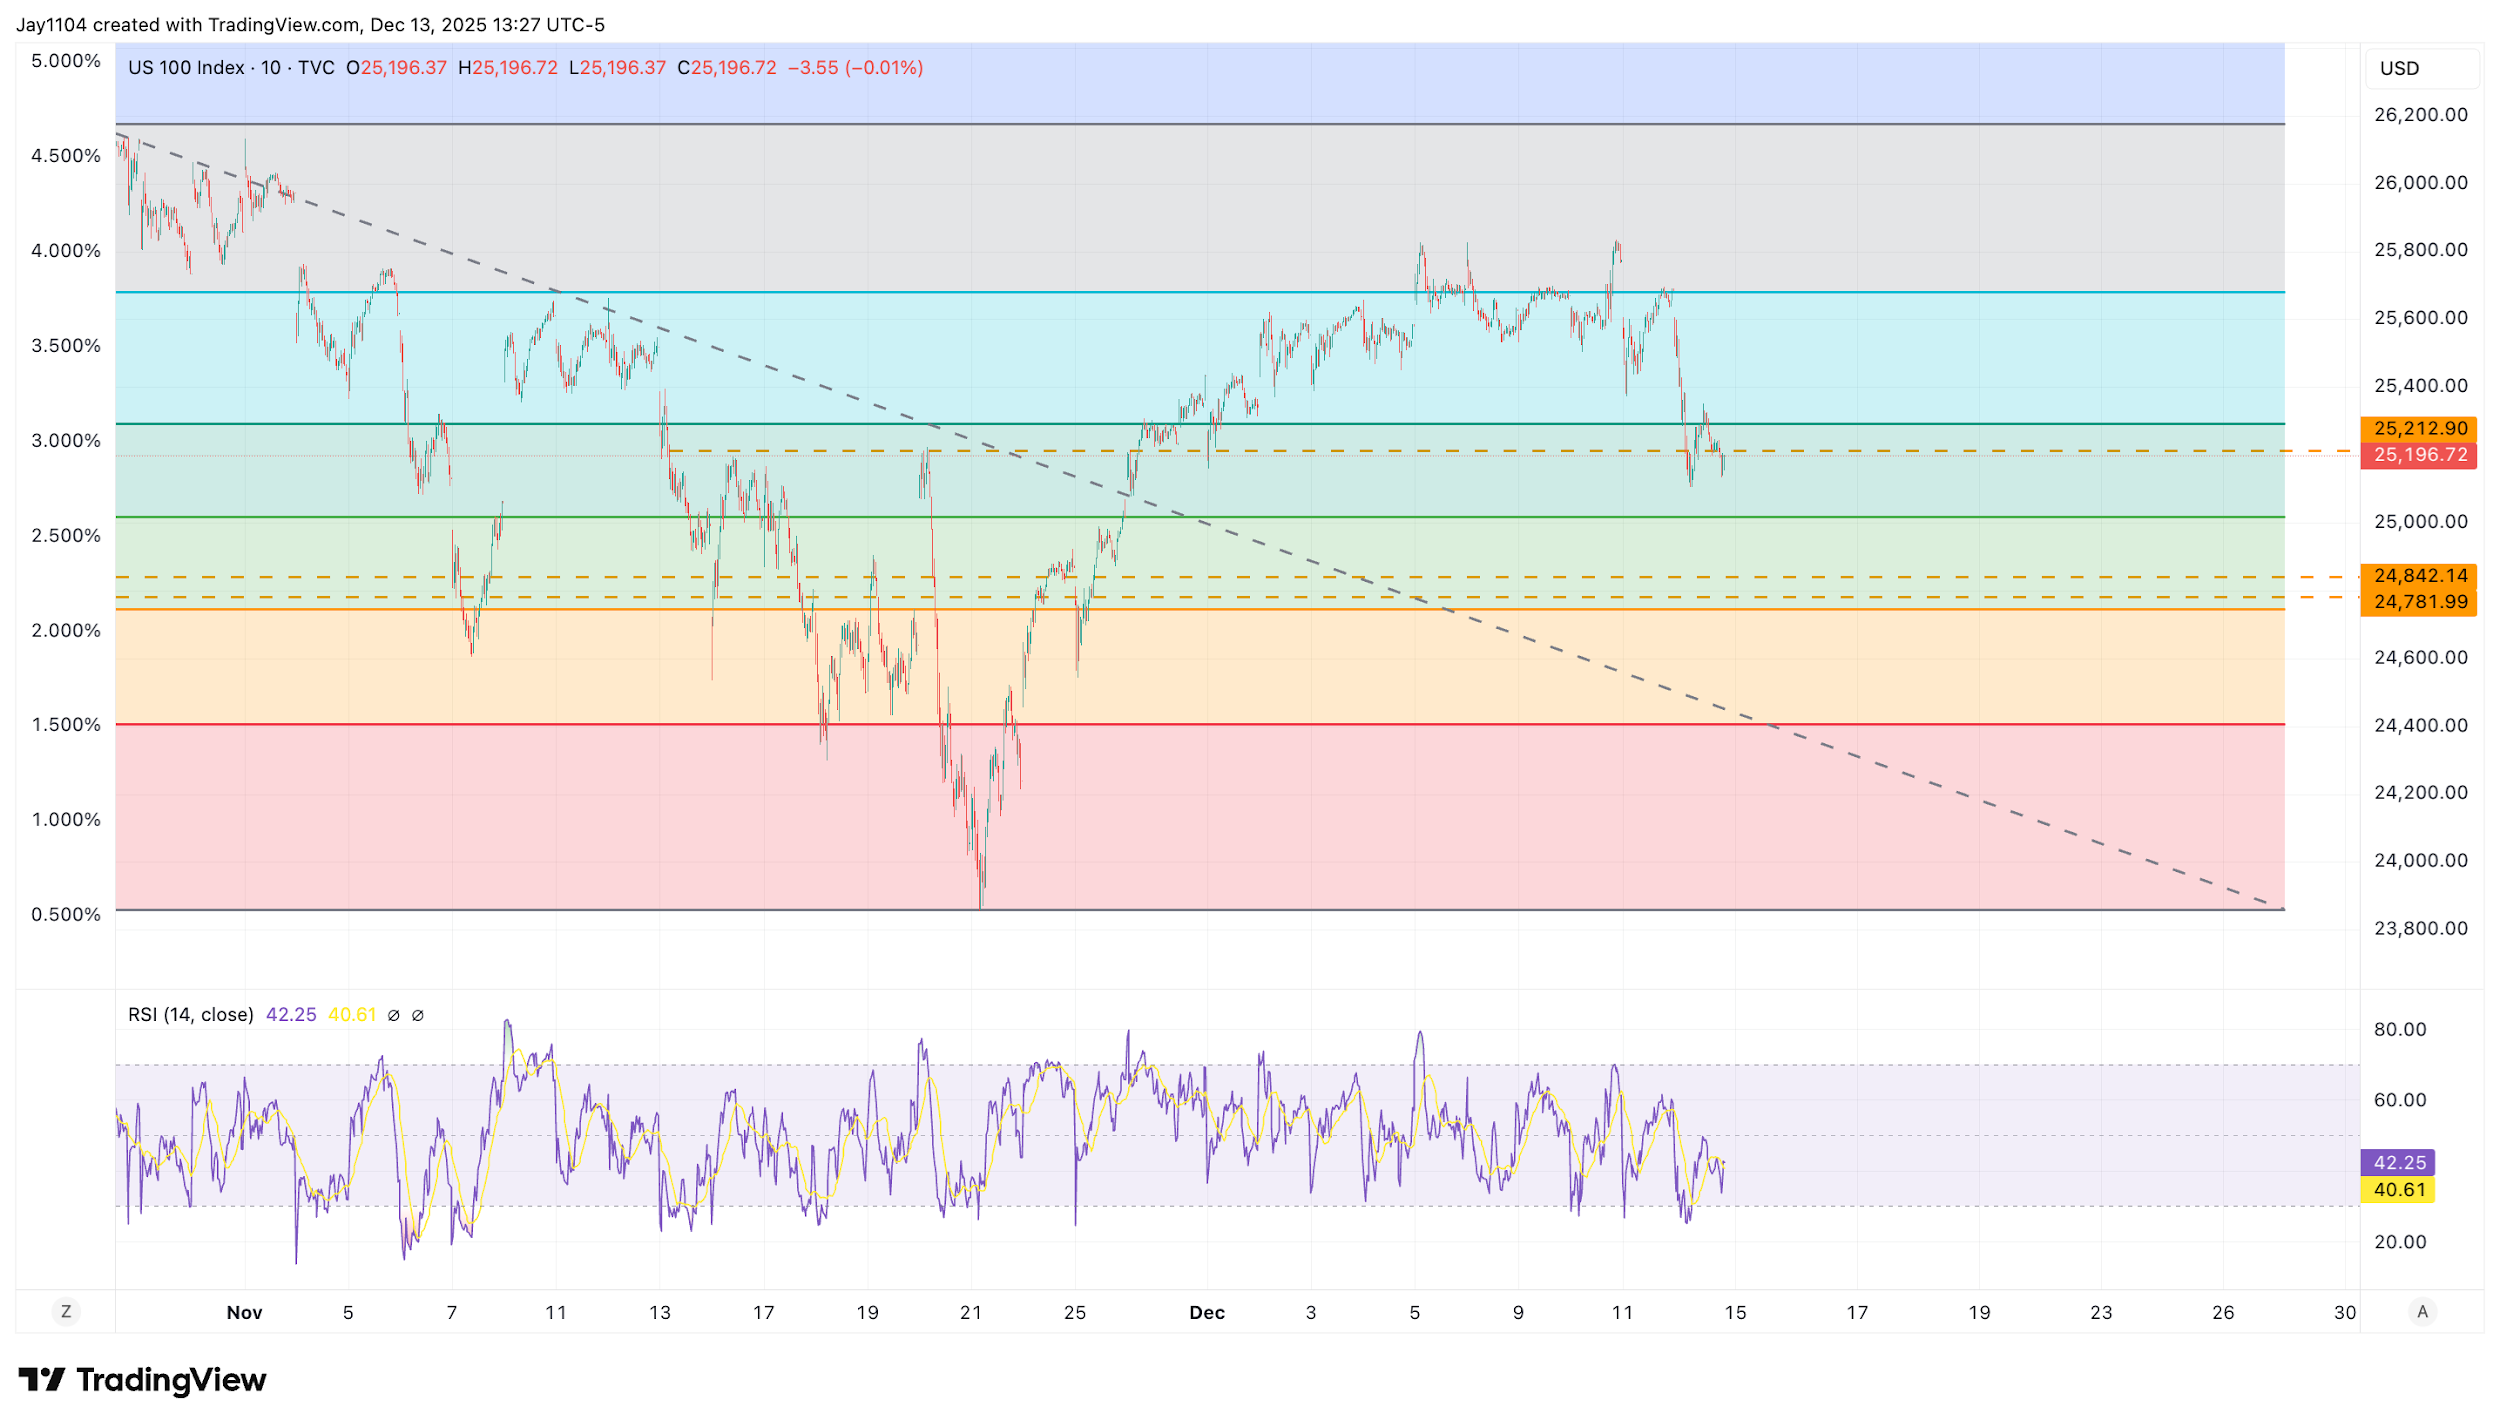
(Source: TradingView)
(Past performance is not a reliable indicator of future results)
S&P 500 Holding On
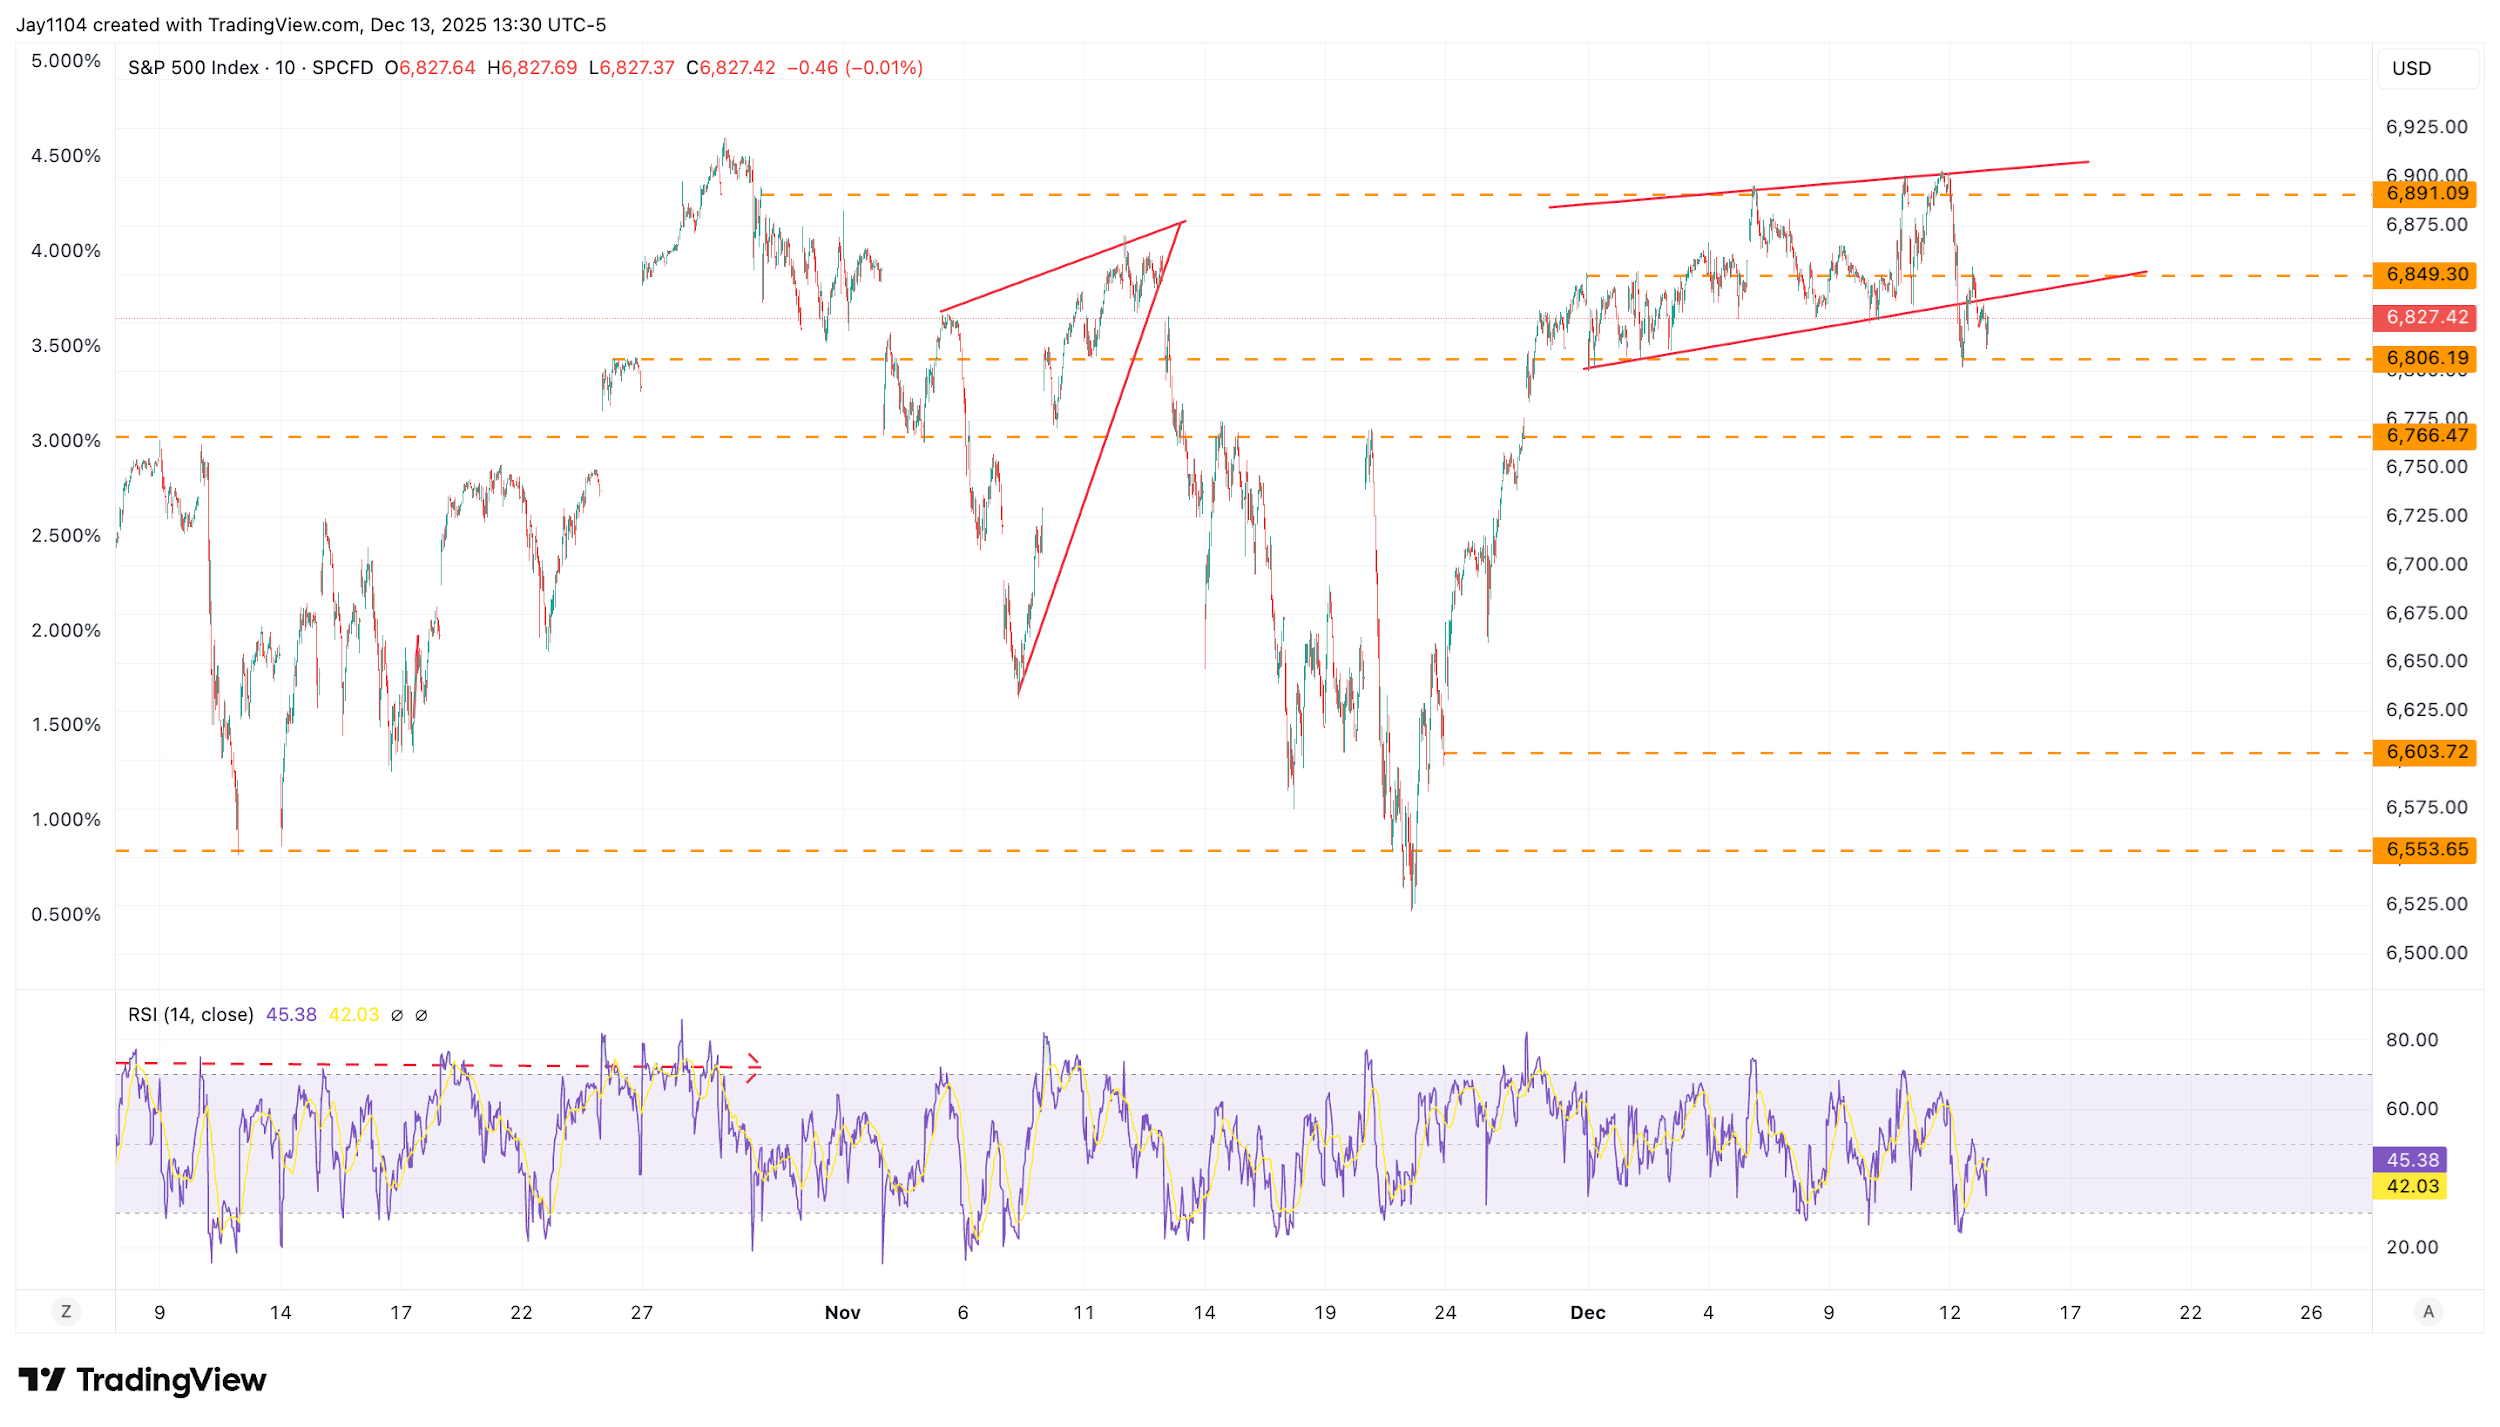
One reason the bulls still have some hope is that, despite the Nasdaq breaking support, the S&P 500 did not. In fact, the S&P 500 found support twice near the 6,800 level on Friday, despite multiple attempts to break below it. This could suggest an opportunity for the bulls to regroup and push the indices back towards their recent highs.
However, if the S&P 500 were to gap lower on Monday morning, 15 December, that would clearly change the situation and could result in the index breaking support at 6,800. It is also worth noting that this week is the December option expiry, meaning option-related flows are likely to play a significant role in trading. As a result, these flows could materially influence the indices' direction over the coming days.
(Source: TradingView)
(Past performance is not a reliable indicator of future results)
Rates Surged
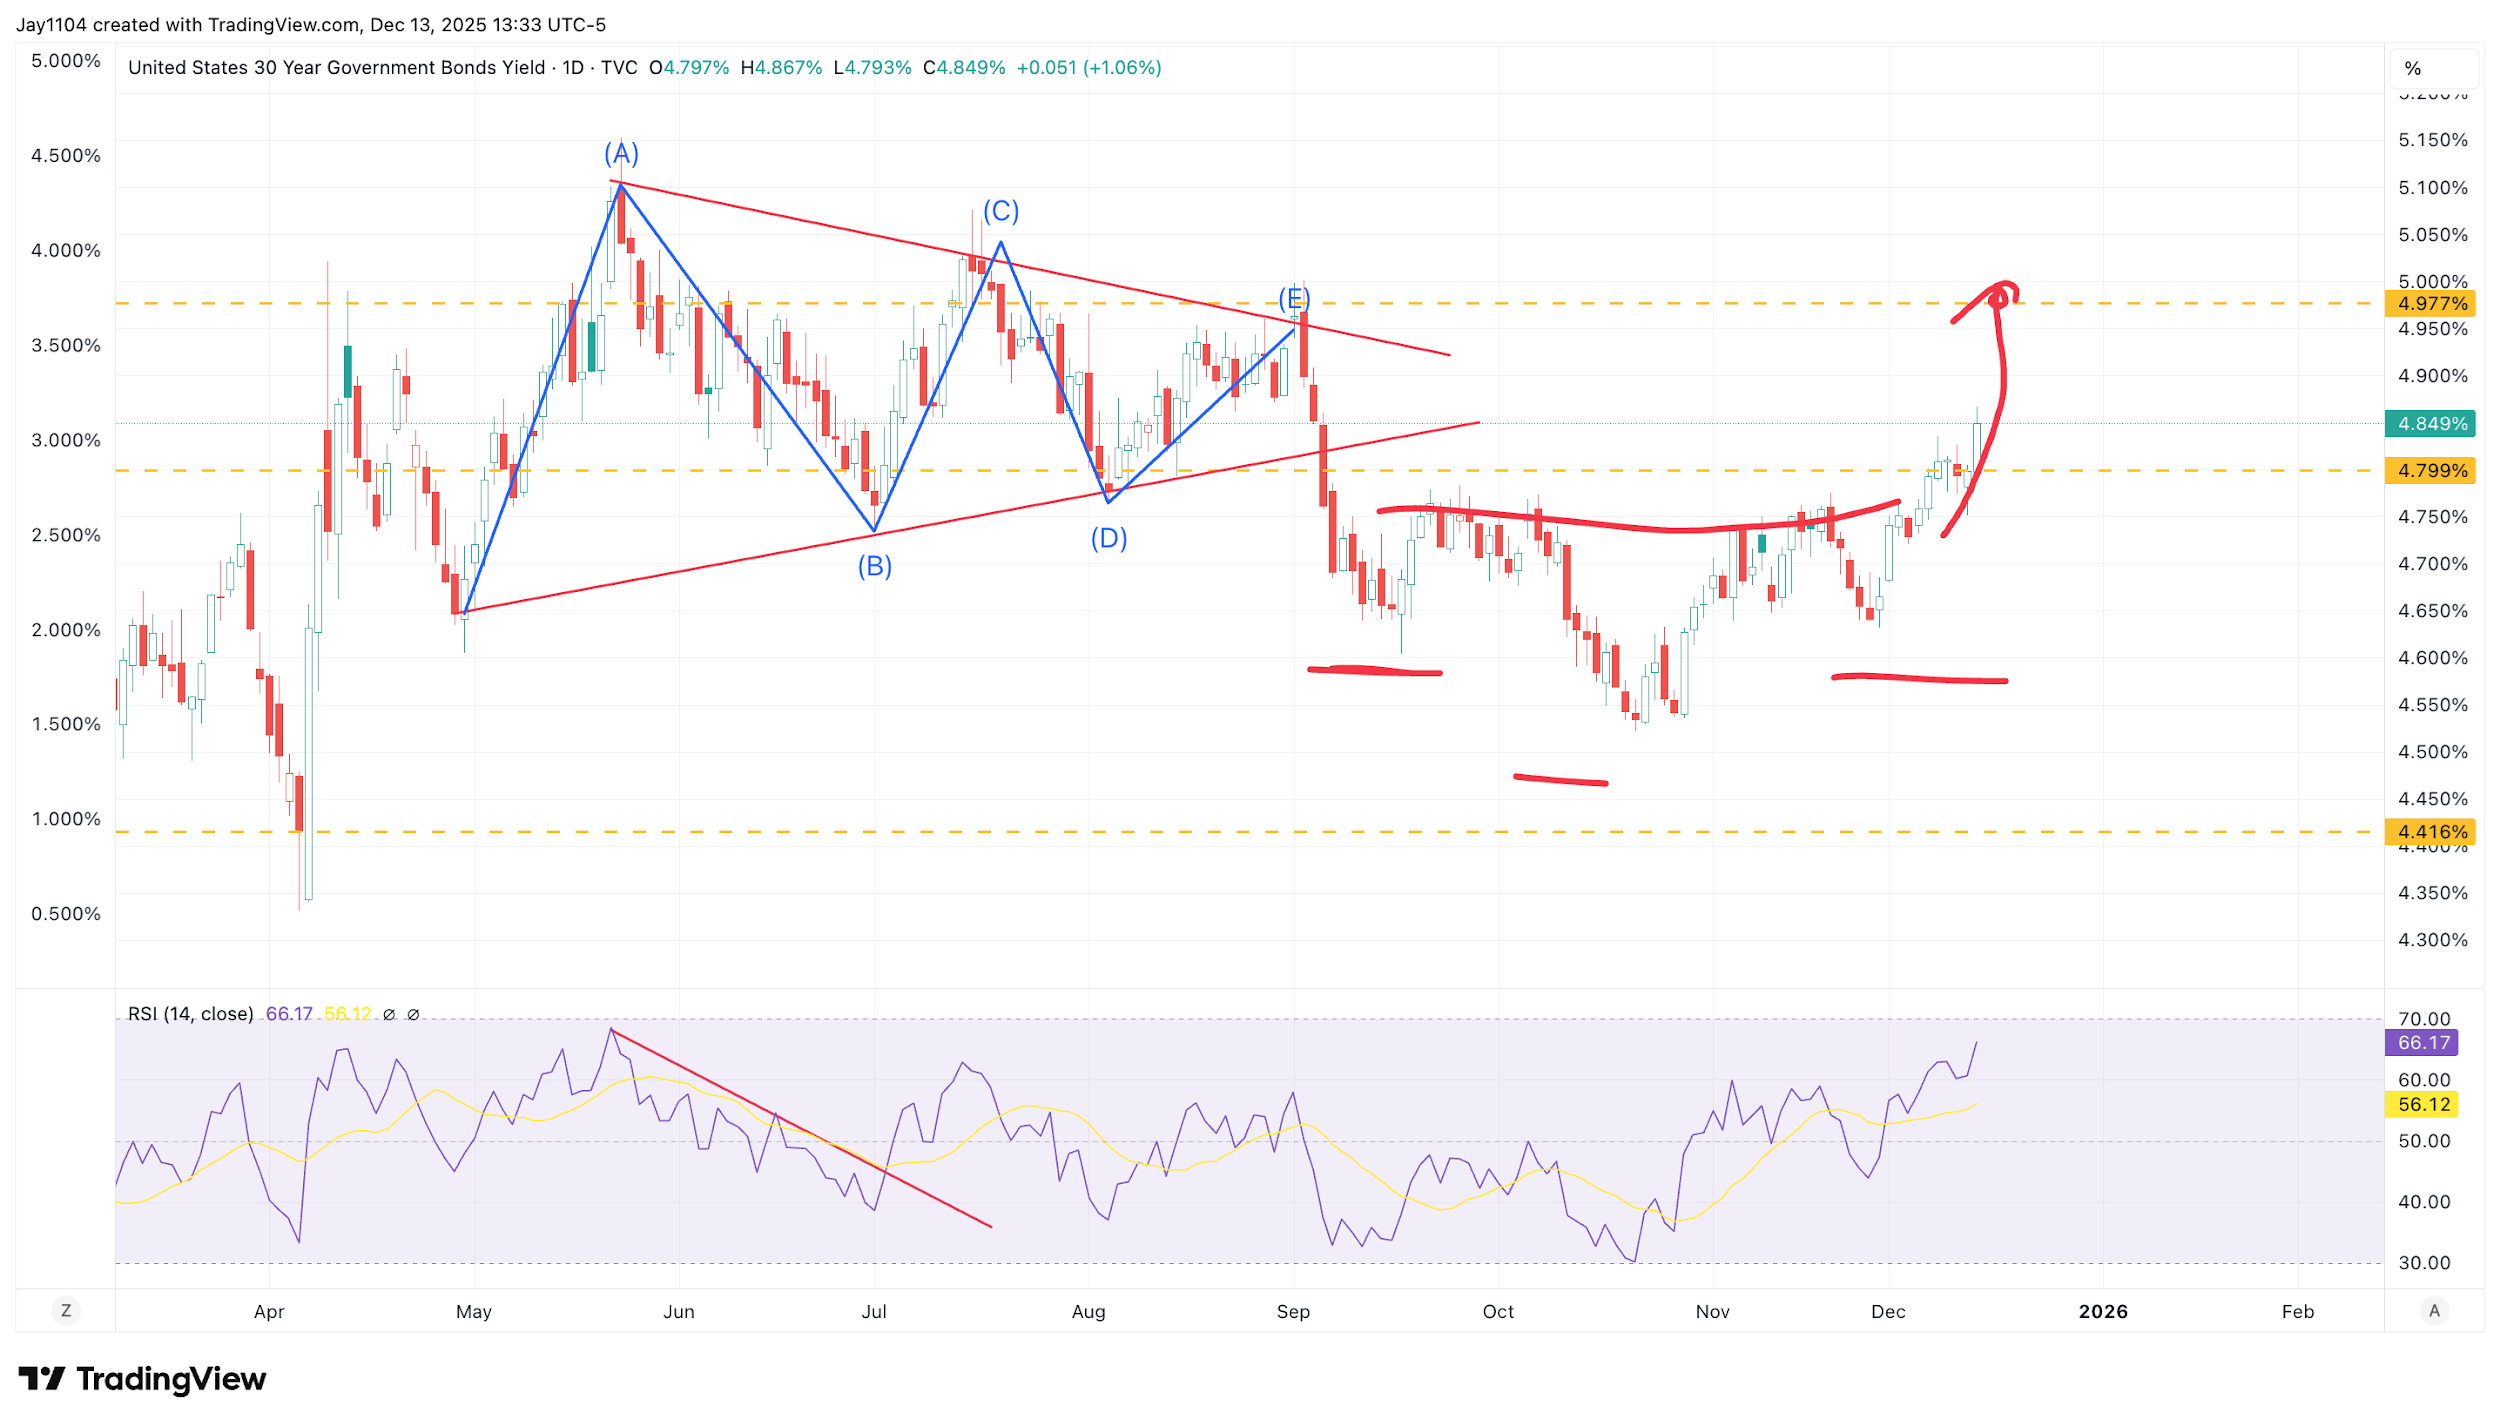
The US 30-year Treasury yield also broke out on Friday, moving above the 4.8% support–resistance zone. It now seems that the 30-year yield could be heading back towards the 5% level seen at the start of September. According to the technical chart, there is very little resistance between the 4.85% and 5% region, which would also help complete the inverse head-and-shoulders pattern that has been forming over the past couple of months, with the neckline near 4.75%.
That, in turn, could become a headwind for risk assets, particularly if the 30-year yield approaches 5%. Momentum remains firm, with the relative strength index still below 66 – indicating there may be room for yields to move higher. However, much will depend on upcoming economic data and market sentiment.
(Source: TradingView)
(Past performance is not a reliable indicator of future results)
Big Week for the EURJPY With ECB and BOJ Meetings
It will also be a significant week for central bank meetings, with both the ECB and the BOJ scheduled to deliver rate decisions at the end of the week. While the ECB is expected to keep rates unchanged, market watchers are anticipating a possible 25-basis-point hike from the BOJ – though this remains subject to incoming data and the Bank’s policy stance.
Investors will nonetheless pay close attention to the ECB. There has been speculation, based on recent comments by Christine Lagarde, that the ECB could upgrade its growth outlook for the eurozone this week. In addition, earlier in the week, ECB Governing Council member Isabel Schnabel noted that she was comfortable with market pricing for interest rate hikes later this year. That combination has helped push the euro–yen cross to new all-time highs, which is clearly bearish for the yen, as it has been weakening sharply against the euro.
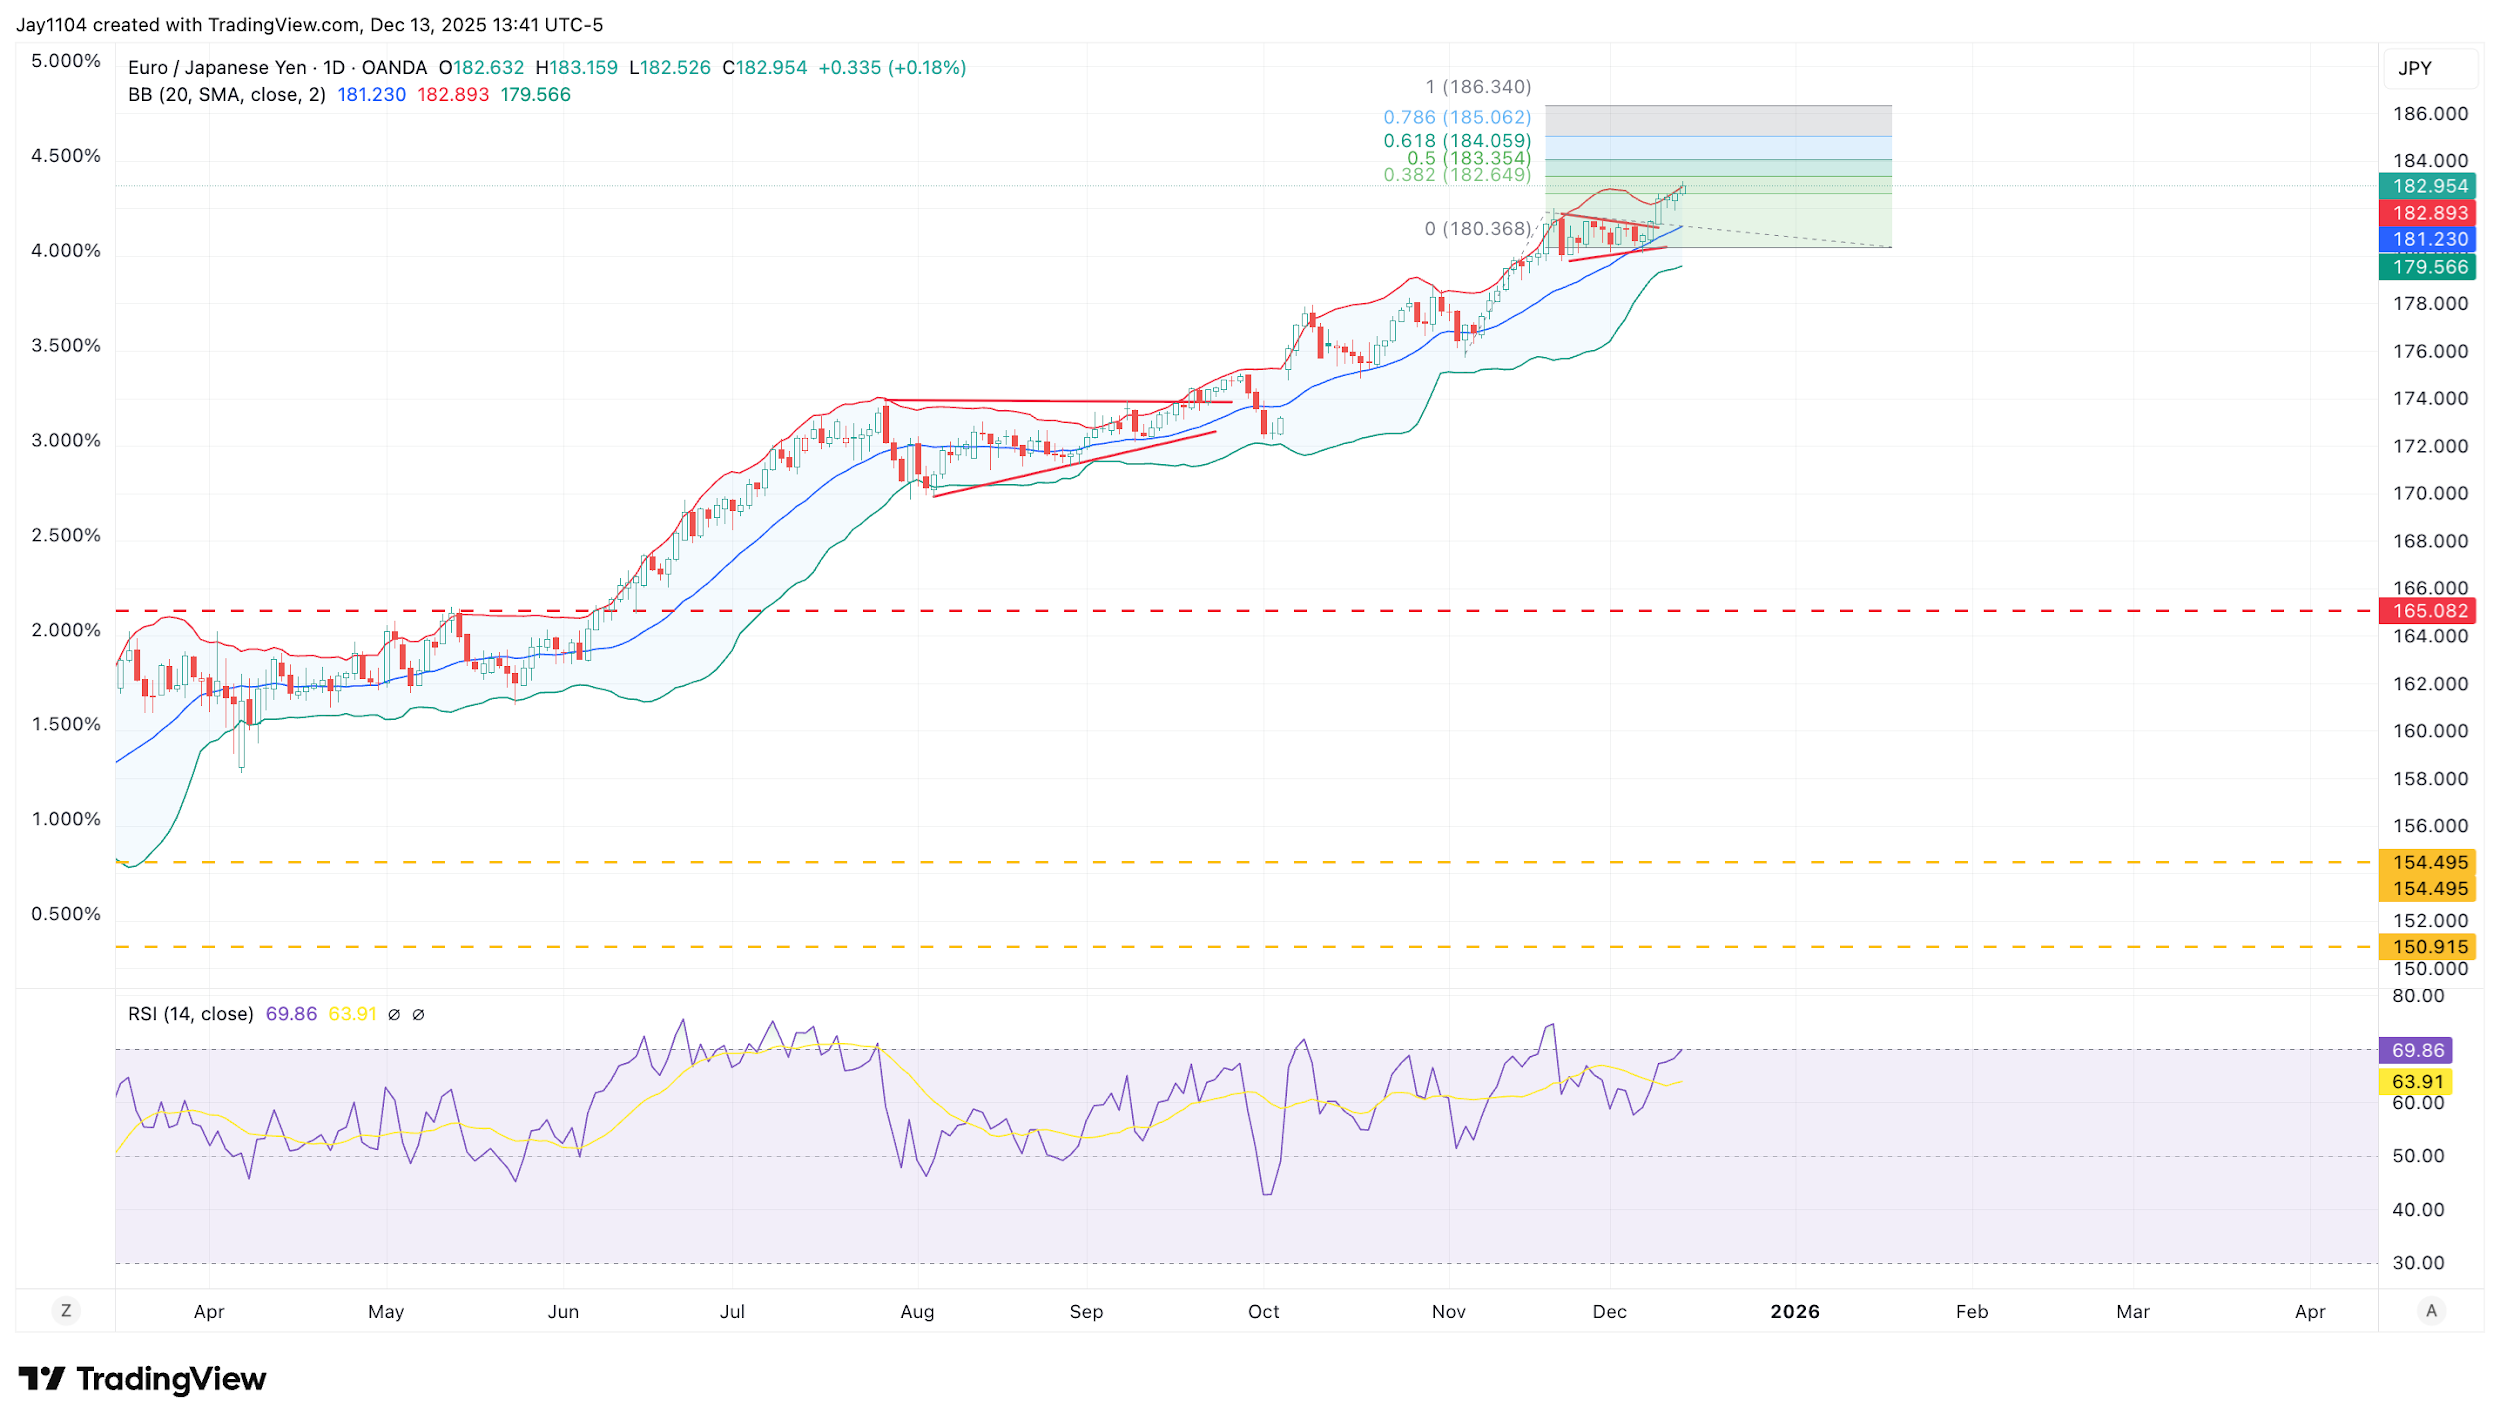
That said, the euro–yen appears somewhat overextended at current levels. The pair is trading above its upper Bollinger Band, with an RSI of around 70. However, the technical chart shows a bullish pennant pattern has formed in euro–yen, which could signal the potential for further upward movement if confirmed. That said, if key support levels fail to hold, a shift lower can’t be ruled out.
(Source: TradingView)
(Past performance is not a reliable indicator of future results)