Stock Market Rally Driven by Implied Volatility Collapse
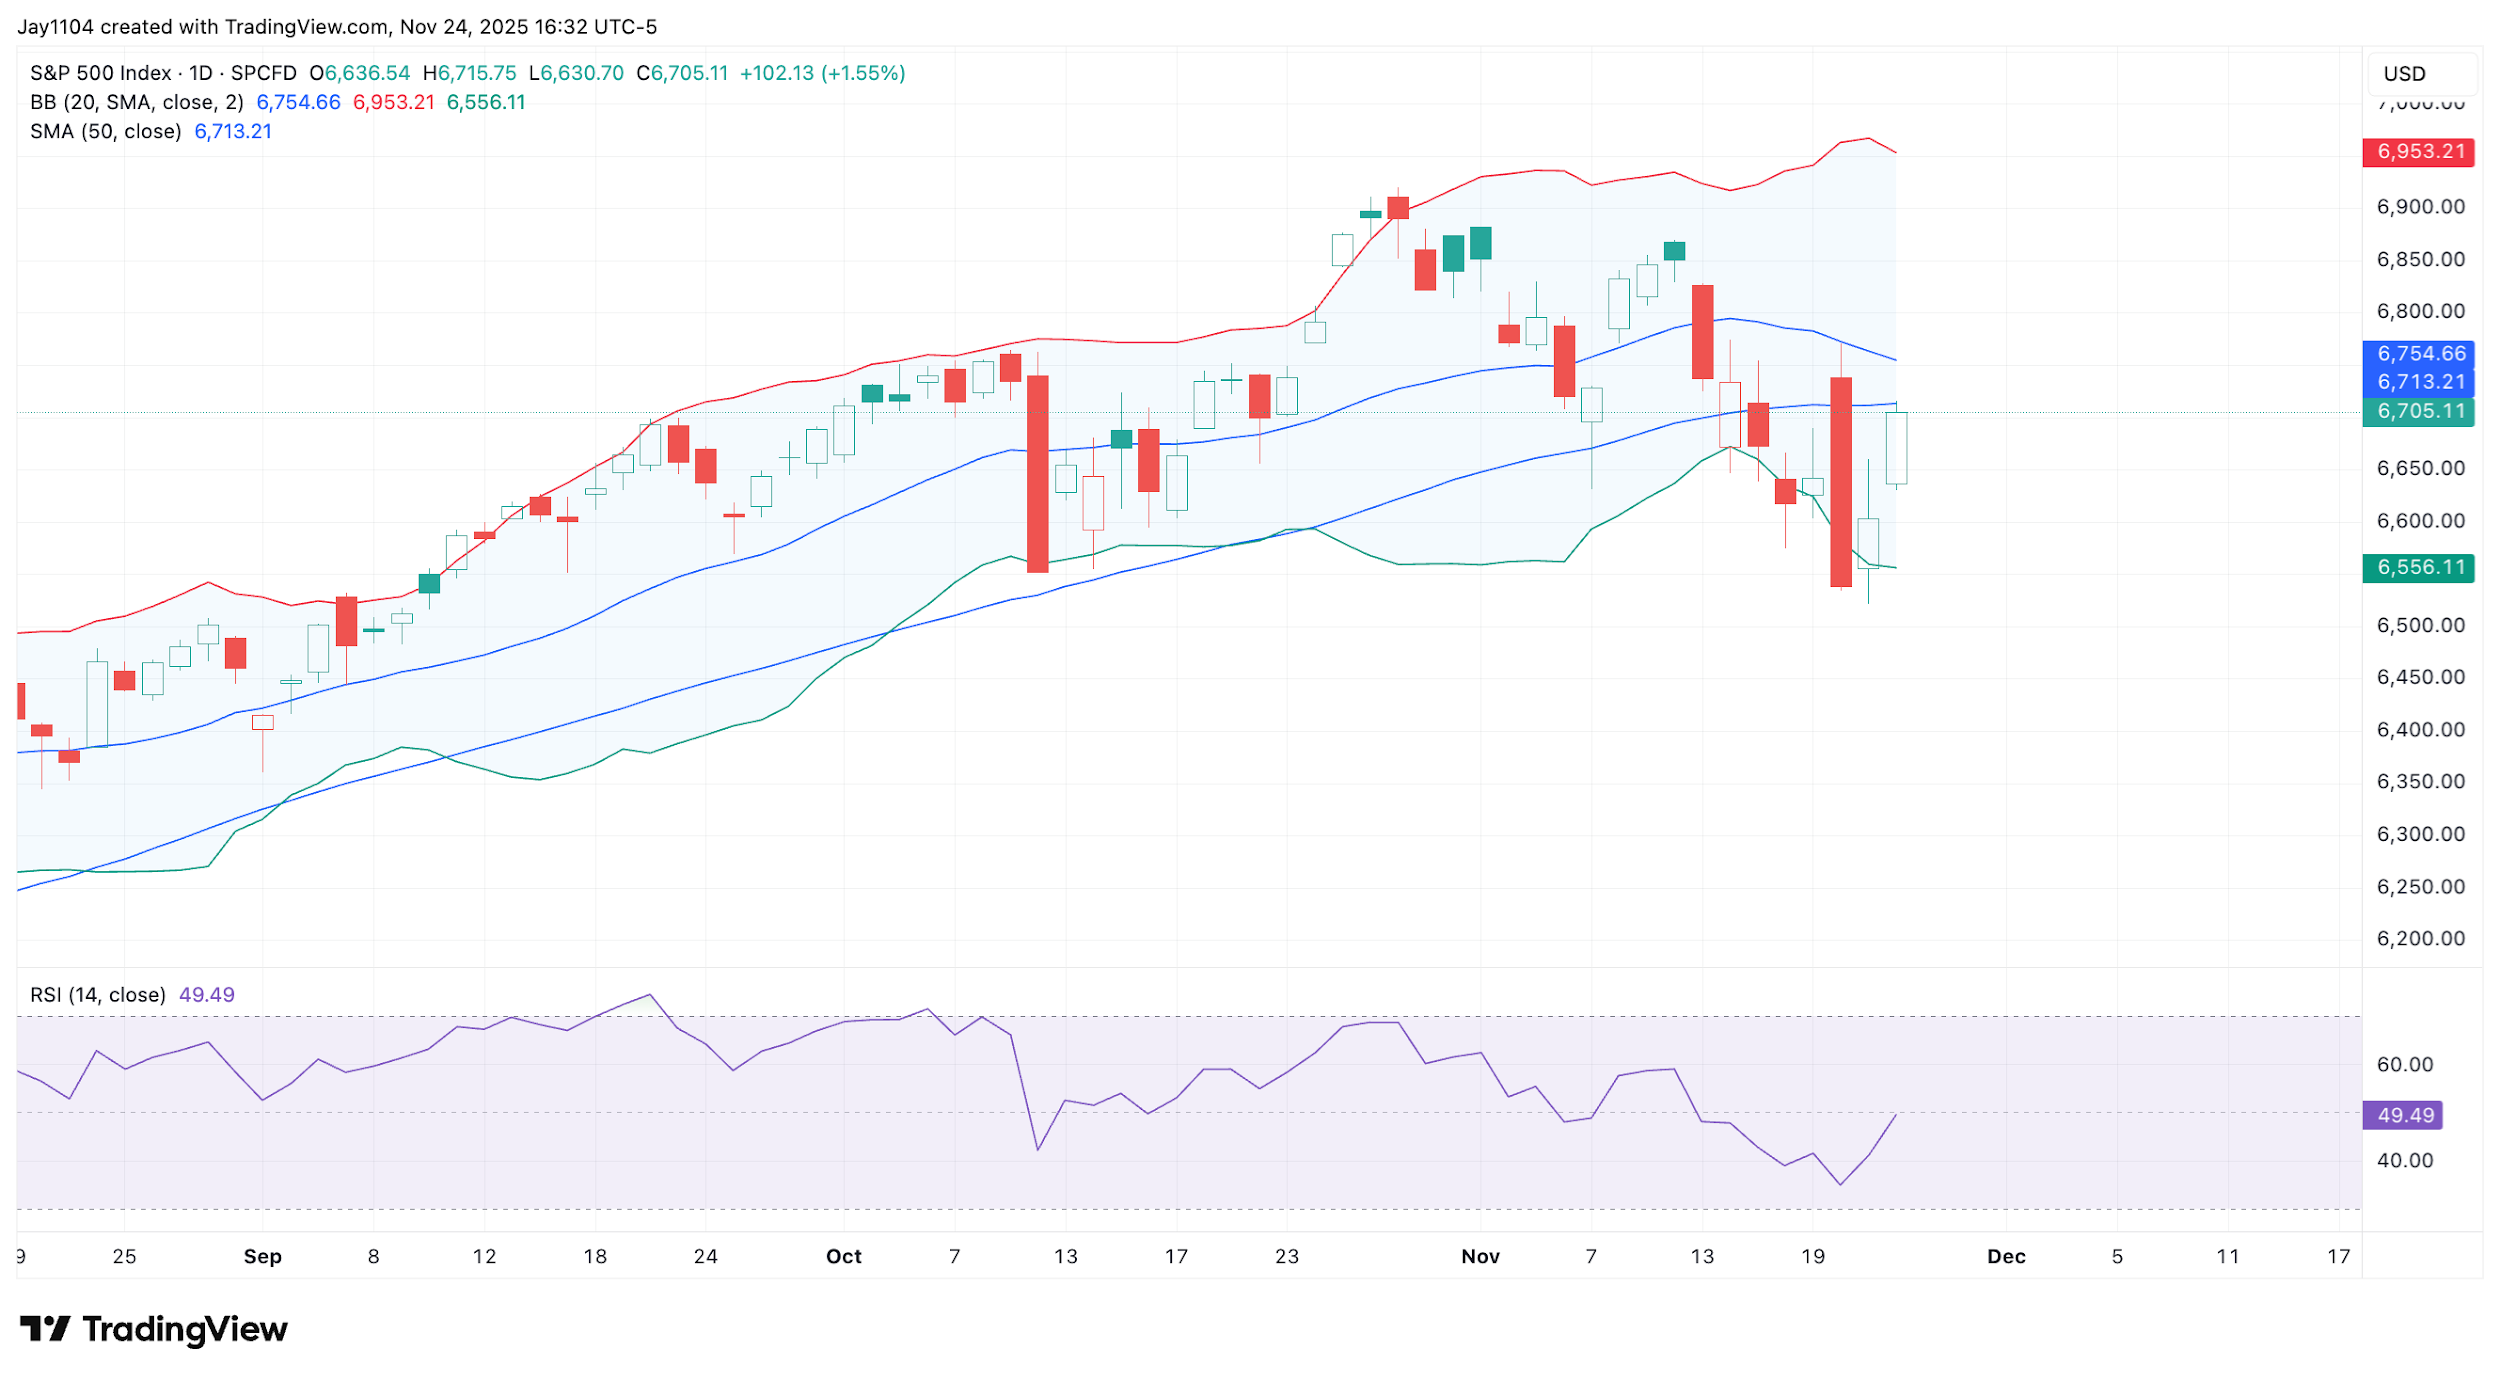
The trading range in the stock market widened on 24 November, with the S&P 500 rising by around 1.5%.
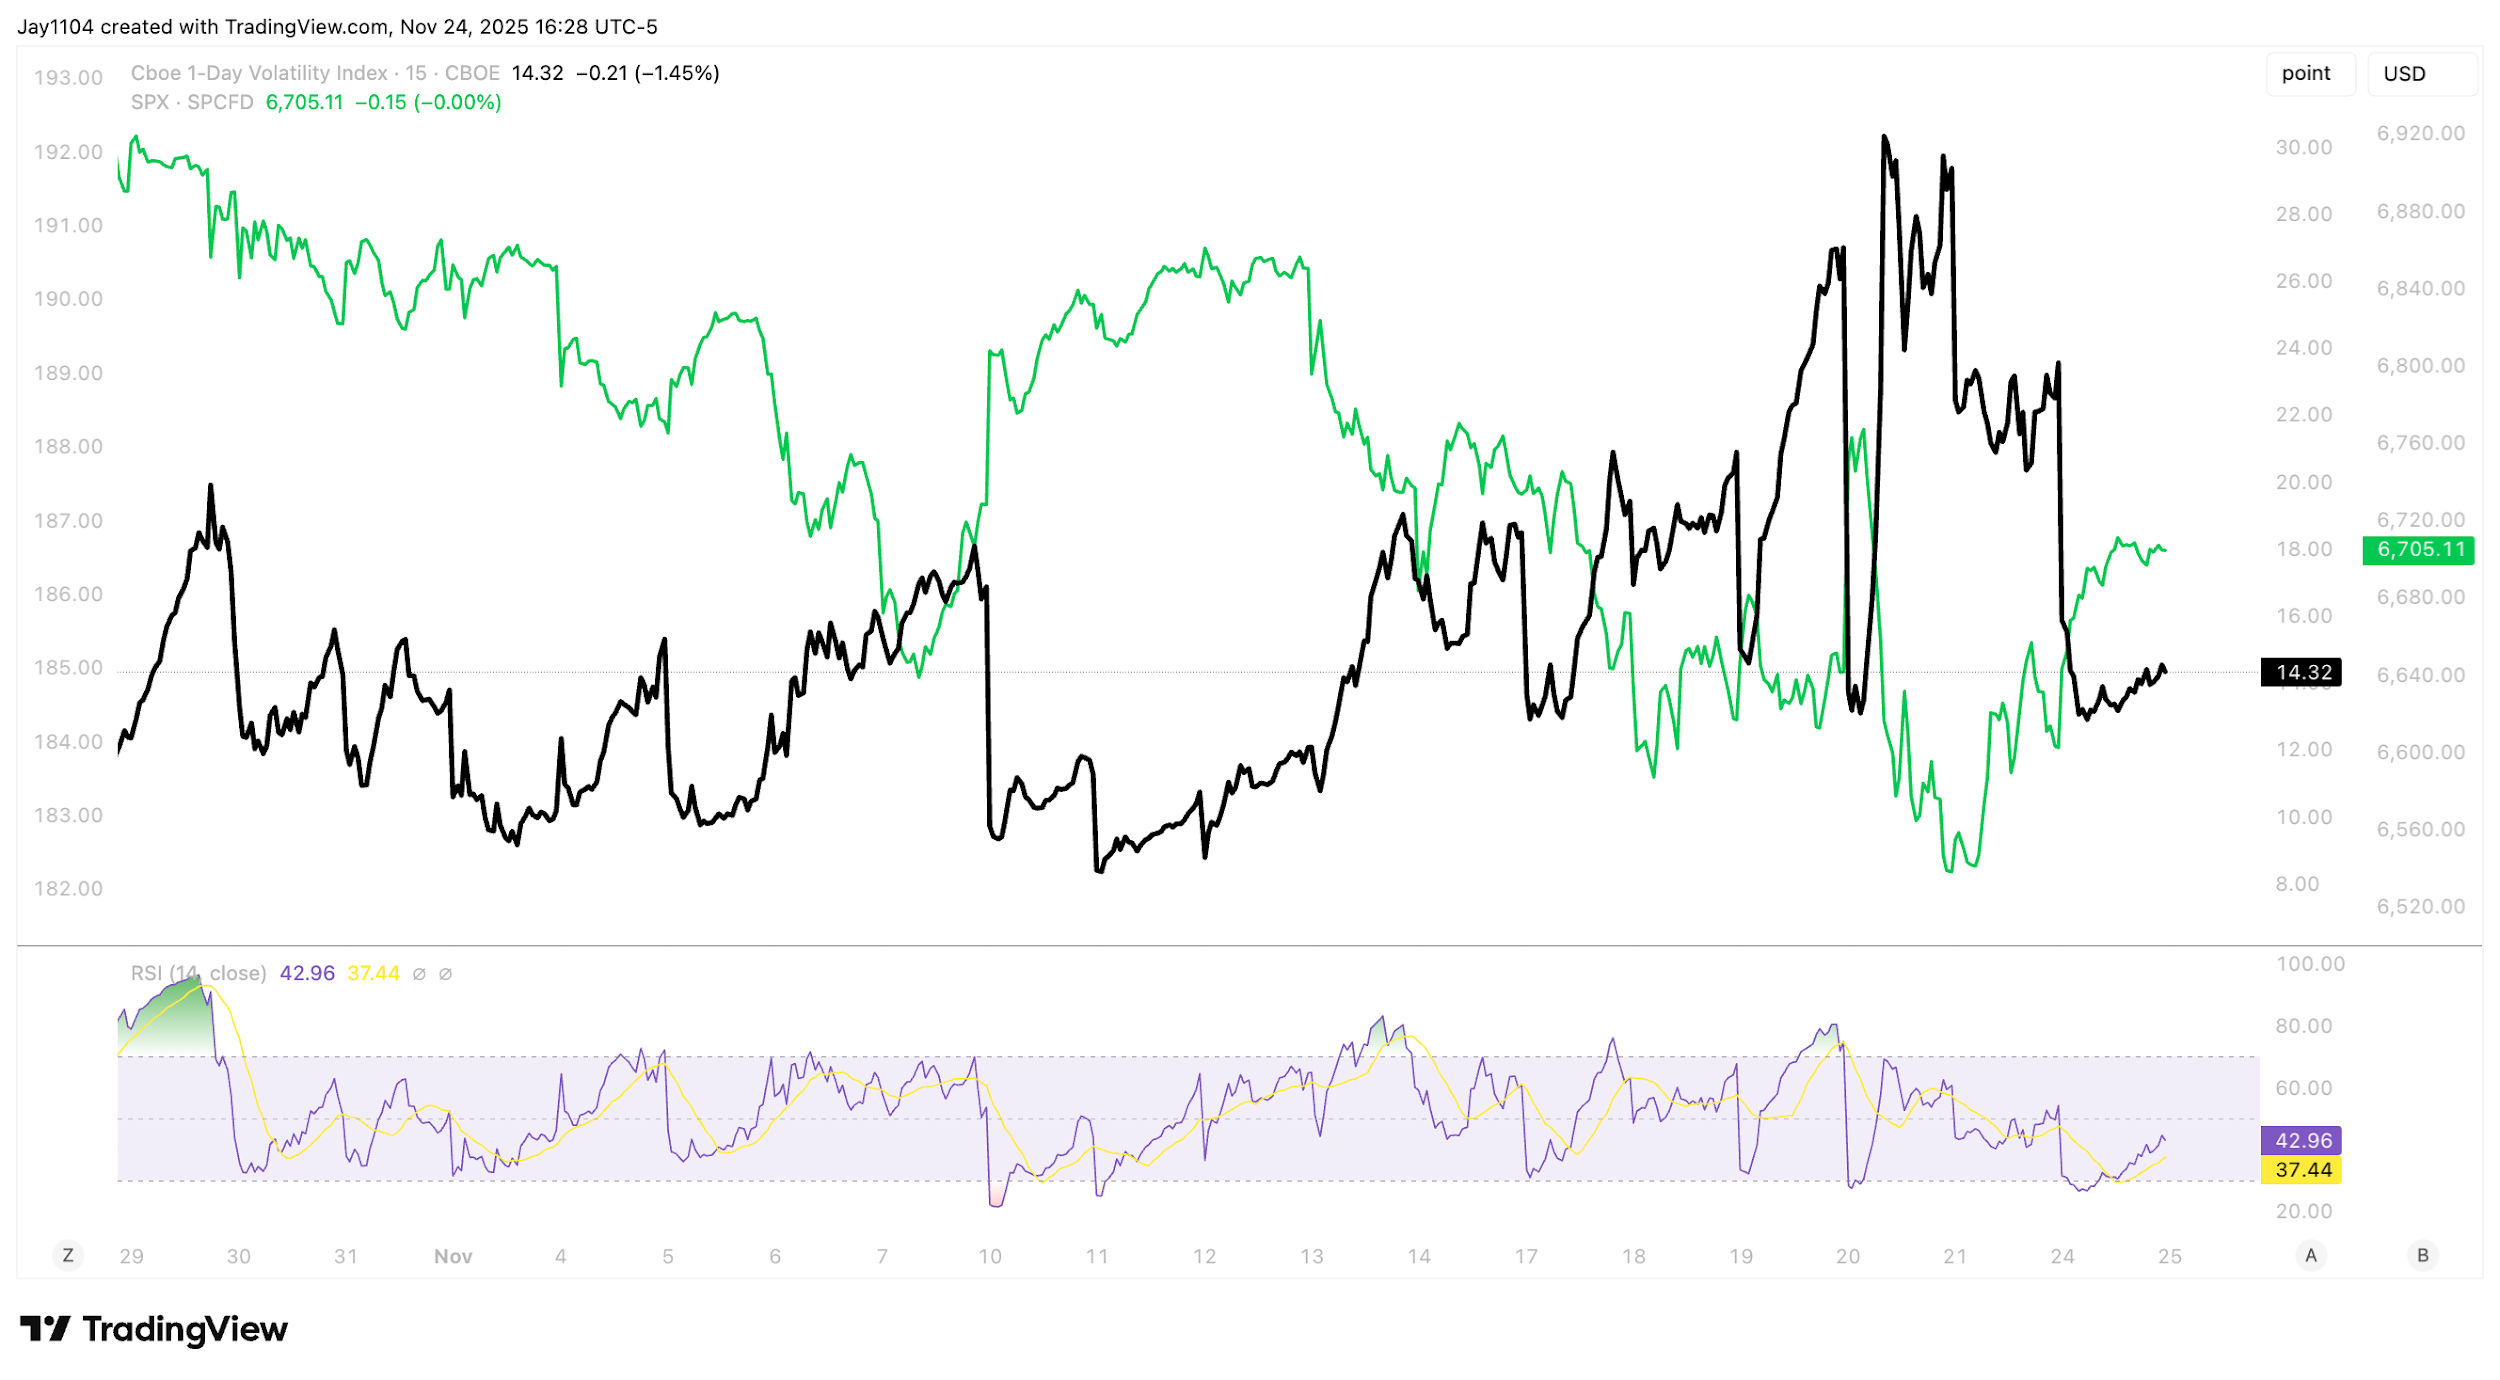
This was driven by the collapse in implied volatility following last week’s Nvidia earnings and jobs report. This was evident in the VIX 1-Day, which fell sharply to just 14.3 from its close on Friday at 23.5, helping propel equity markets higher.

The VIX index also fell to around 20.5. With implied volatility levels now essentially reset, the market has an opportunity to stabilise on Tuesday, as this pattern has unfolded on recent Mondays. Additionally, the index appeared to stall around the 6,700 level, which is a significant options positioning area and likely the reason the S&P 500 was unable to move meaningfully beyond that level once reached early on Monday afternoon.
(Source: TradingView)
Past performance is not a reliable indicator of future results.
But perhaps what stands out more is that the index rose right up to its 50-day moving average, which is at 6,713, and then seemed to offer resistance. [Chart2] We have seen this moving average act as resistance from time to time, although more recently it has not been a major factor in guiding the index’s direction. Today, however, it did appear to matter. This will be something to watch as we head into Tuesday — whether the index can push beyond that level or whether it continues to act as resistance.
(Source: TradingView)
Past performance is not a reliable indicator of future results.
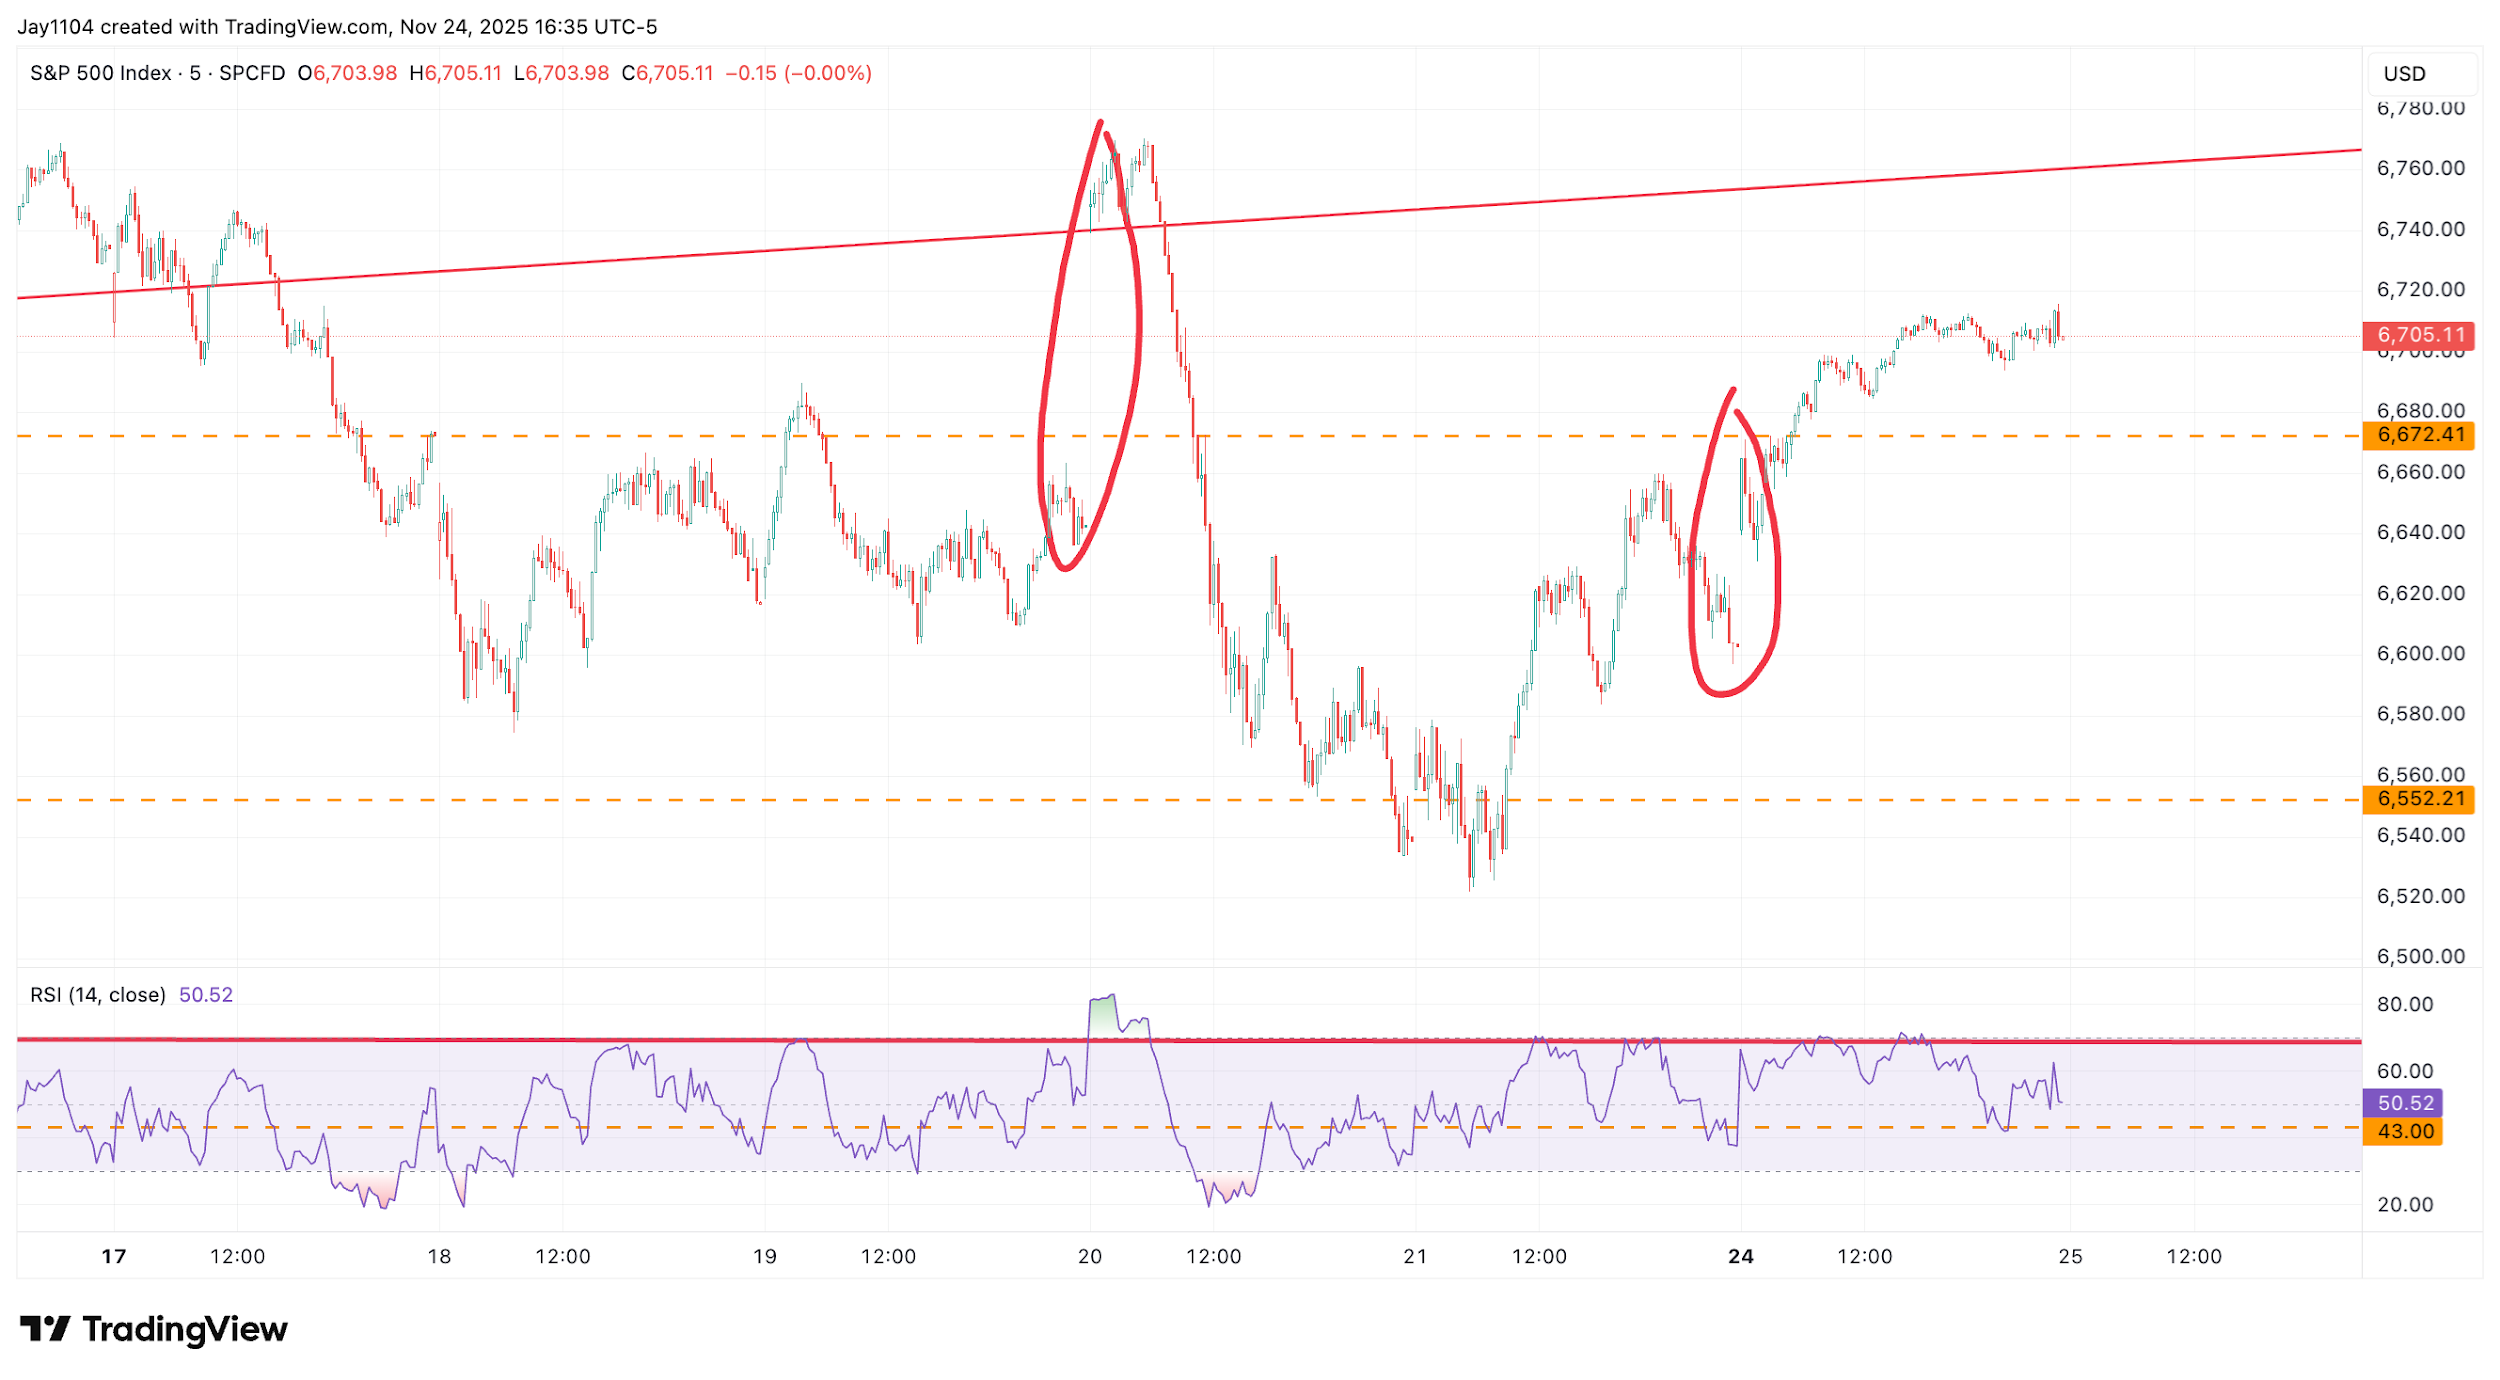
Additionally, with the tailwind from the implied volatility crush no longer supporting the market, a breakout to higher levels may prove more difficult in the S&P 500, leaving the possibility of a retracement of Monday’s gains open.
Technically, the weak close on Friday on 21 November, along with the gap opening on Monday, created a gap pattern that tends to fill within a few trading days, as these patterns are largely unstable.
(Source: TradingView)
Past performance is not a reliable indicator of future results.
Yen May Weaken Further
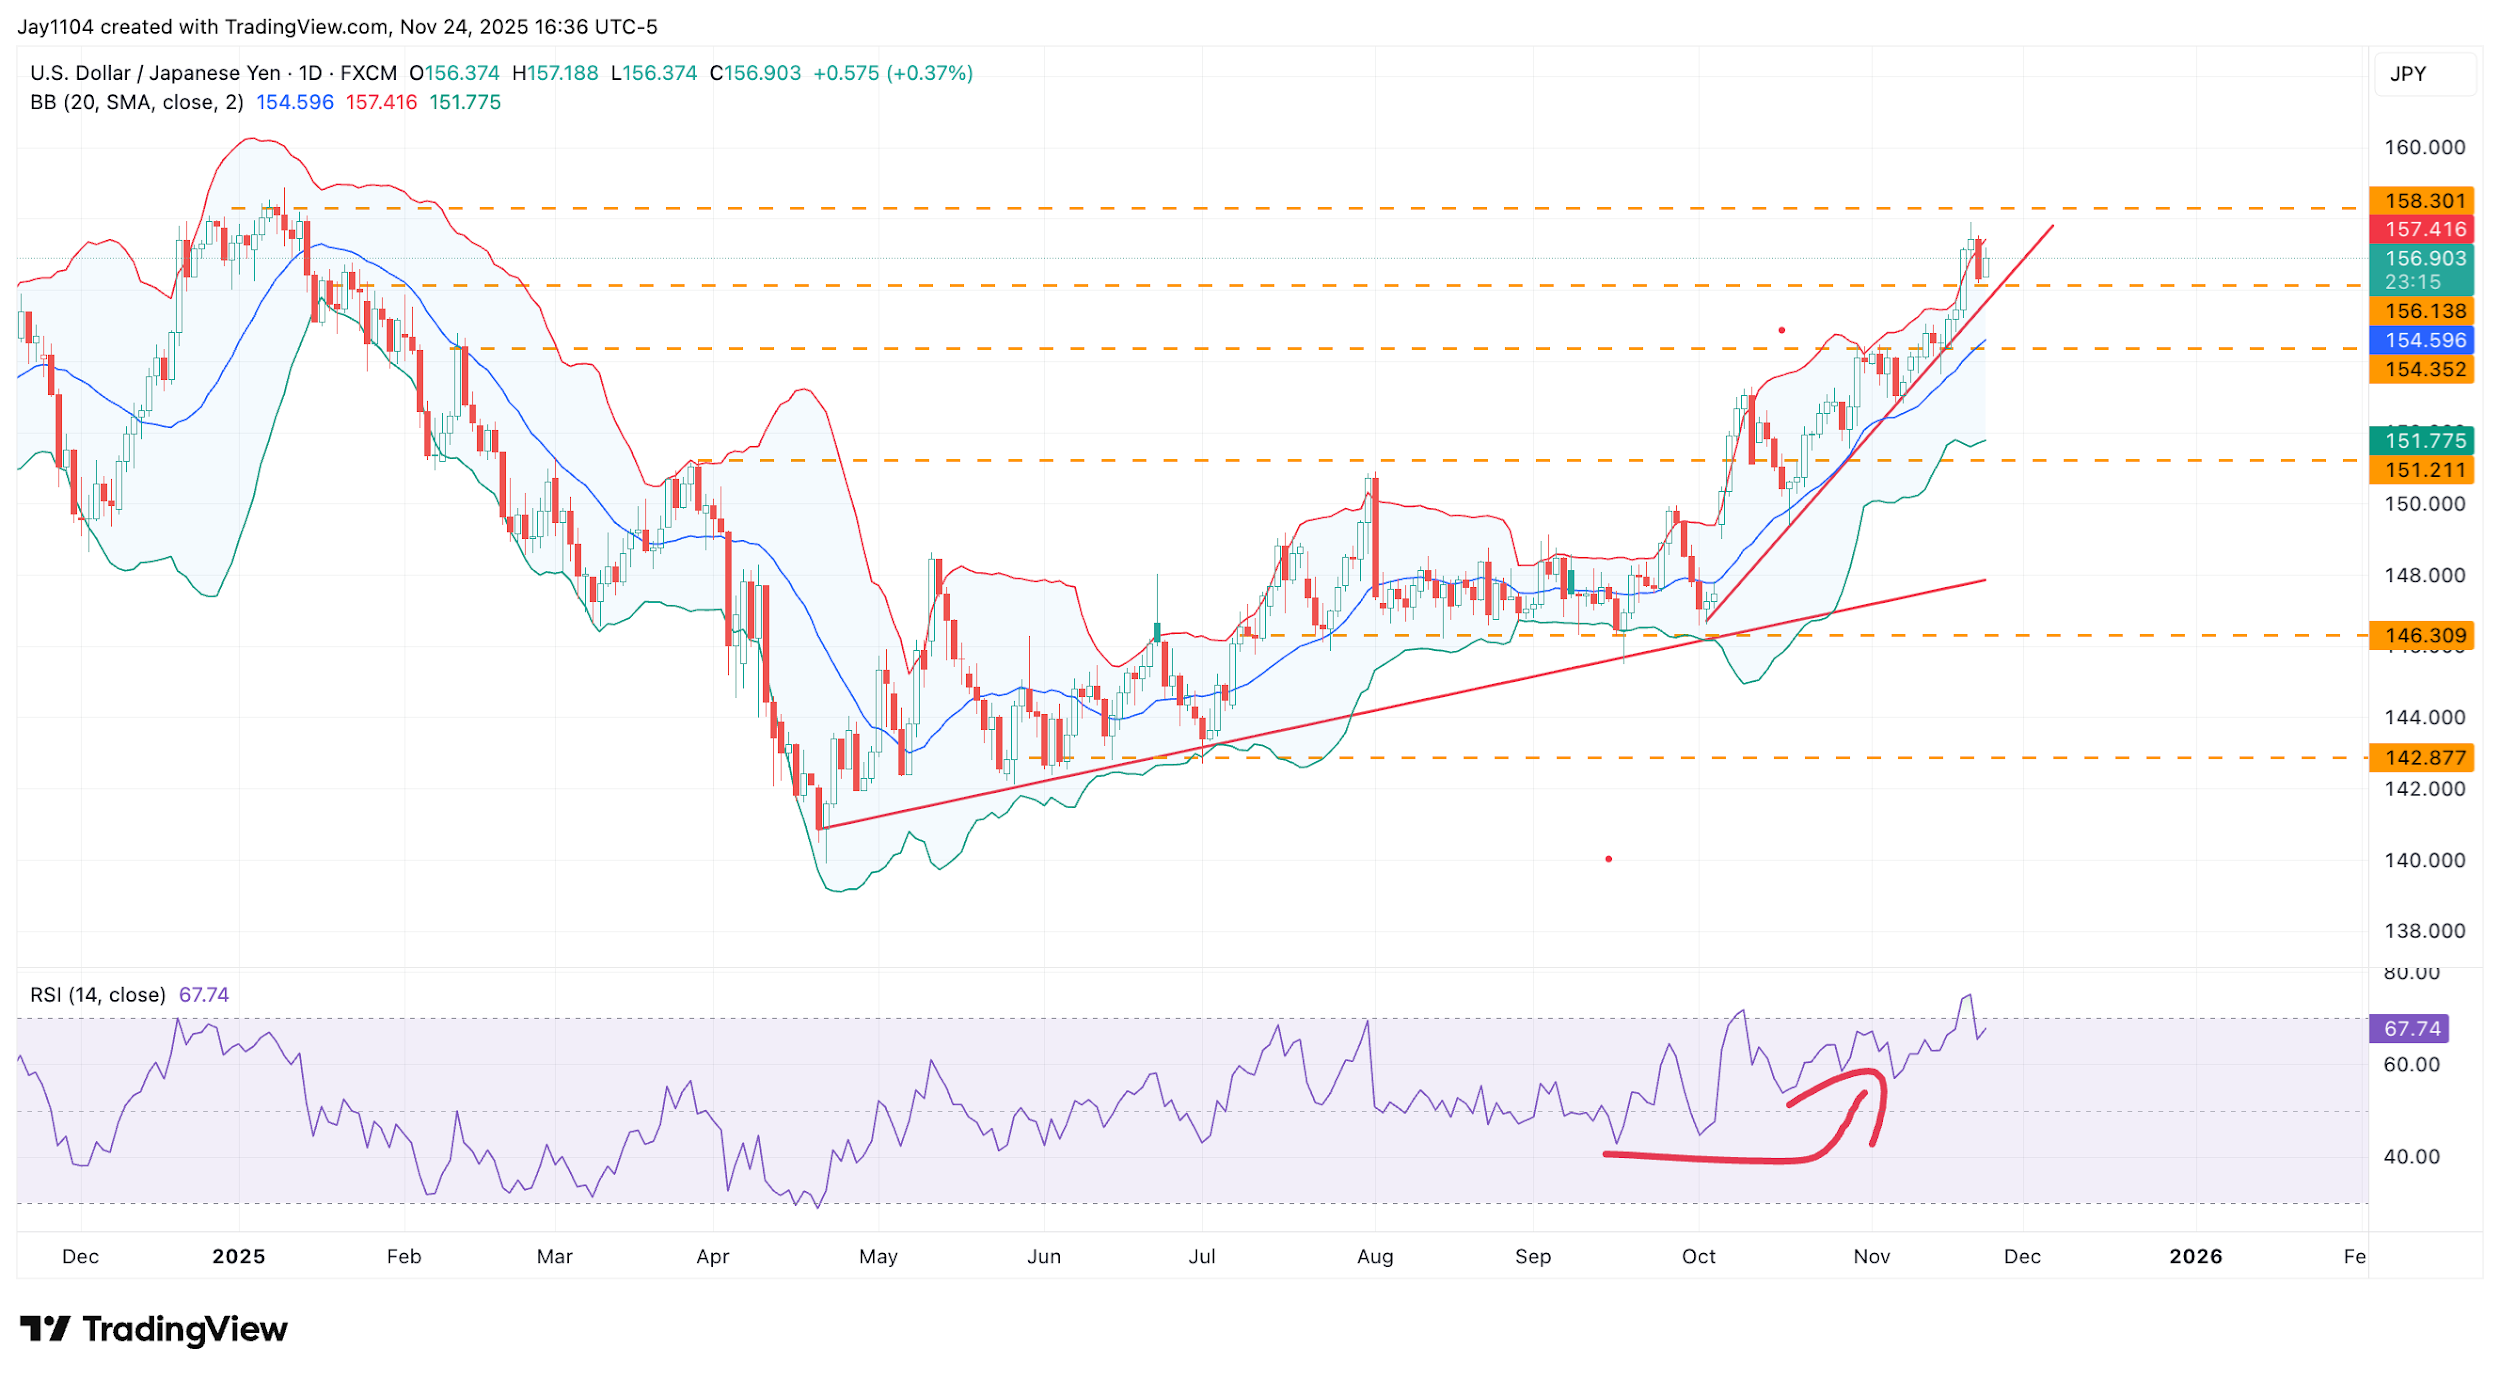
The USDJPY weakened on 24 November, rising to around 156.90. The yen had appeared somewhat overextended at the end of last week; however, that condition seems to have eased, with the currency moving away from its upper Bollinger Band and the RSI slipping back below 70. The USDJPY now appears positioned to continue trending higher — meaning further yen weakness against the dollar. It could potentially extend to the 158.30 resistance level now that the government has officially passed the fiscal stimulus package prepared over the past few weeks. [Chart4]
(Source: TradingView)
Past performance is not a reliable indicator of future results.
Pound May Struggle Versus The Dollar
The British pound strengthened against the dollar today, ahead of the UK Autumn Budget announcement on Wednesday, 26 November. The pound also appears to have worked off some of the overextended conditions last seen at the beginning of November. It is now trading with an RSI of around 40.5 and is well back within the lower Bollinger Band. For the moment, the 20-day moving average seems to be acting as a resistance level. A strong downtrend remains in place, which suggests the pound is likely to continue facing stiff resistance around 1.315. If the downtrend does re-establish itself, the pound could begin weakening against the dollar again as early as Tuesday or Wednesday this week, potentially even undercutting the lows around 1.30. However, a breakout above 1.315 could see the pound strengthen against the dollar towards 1.327.
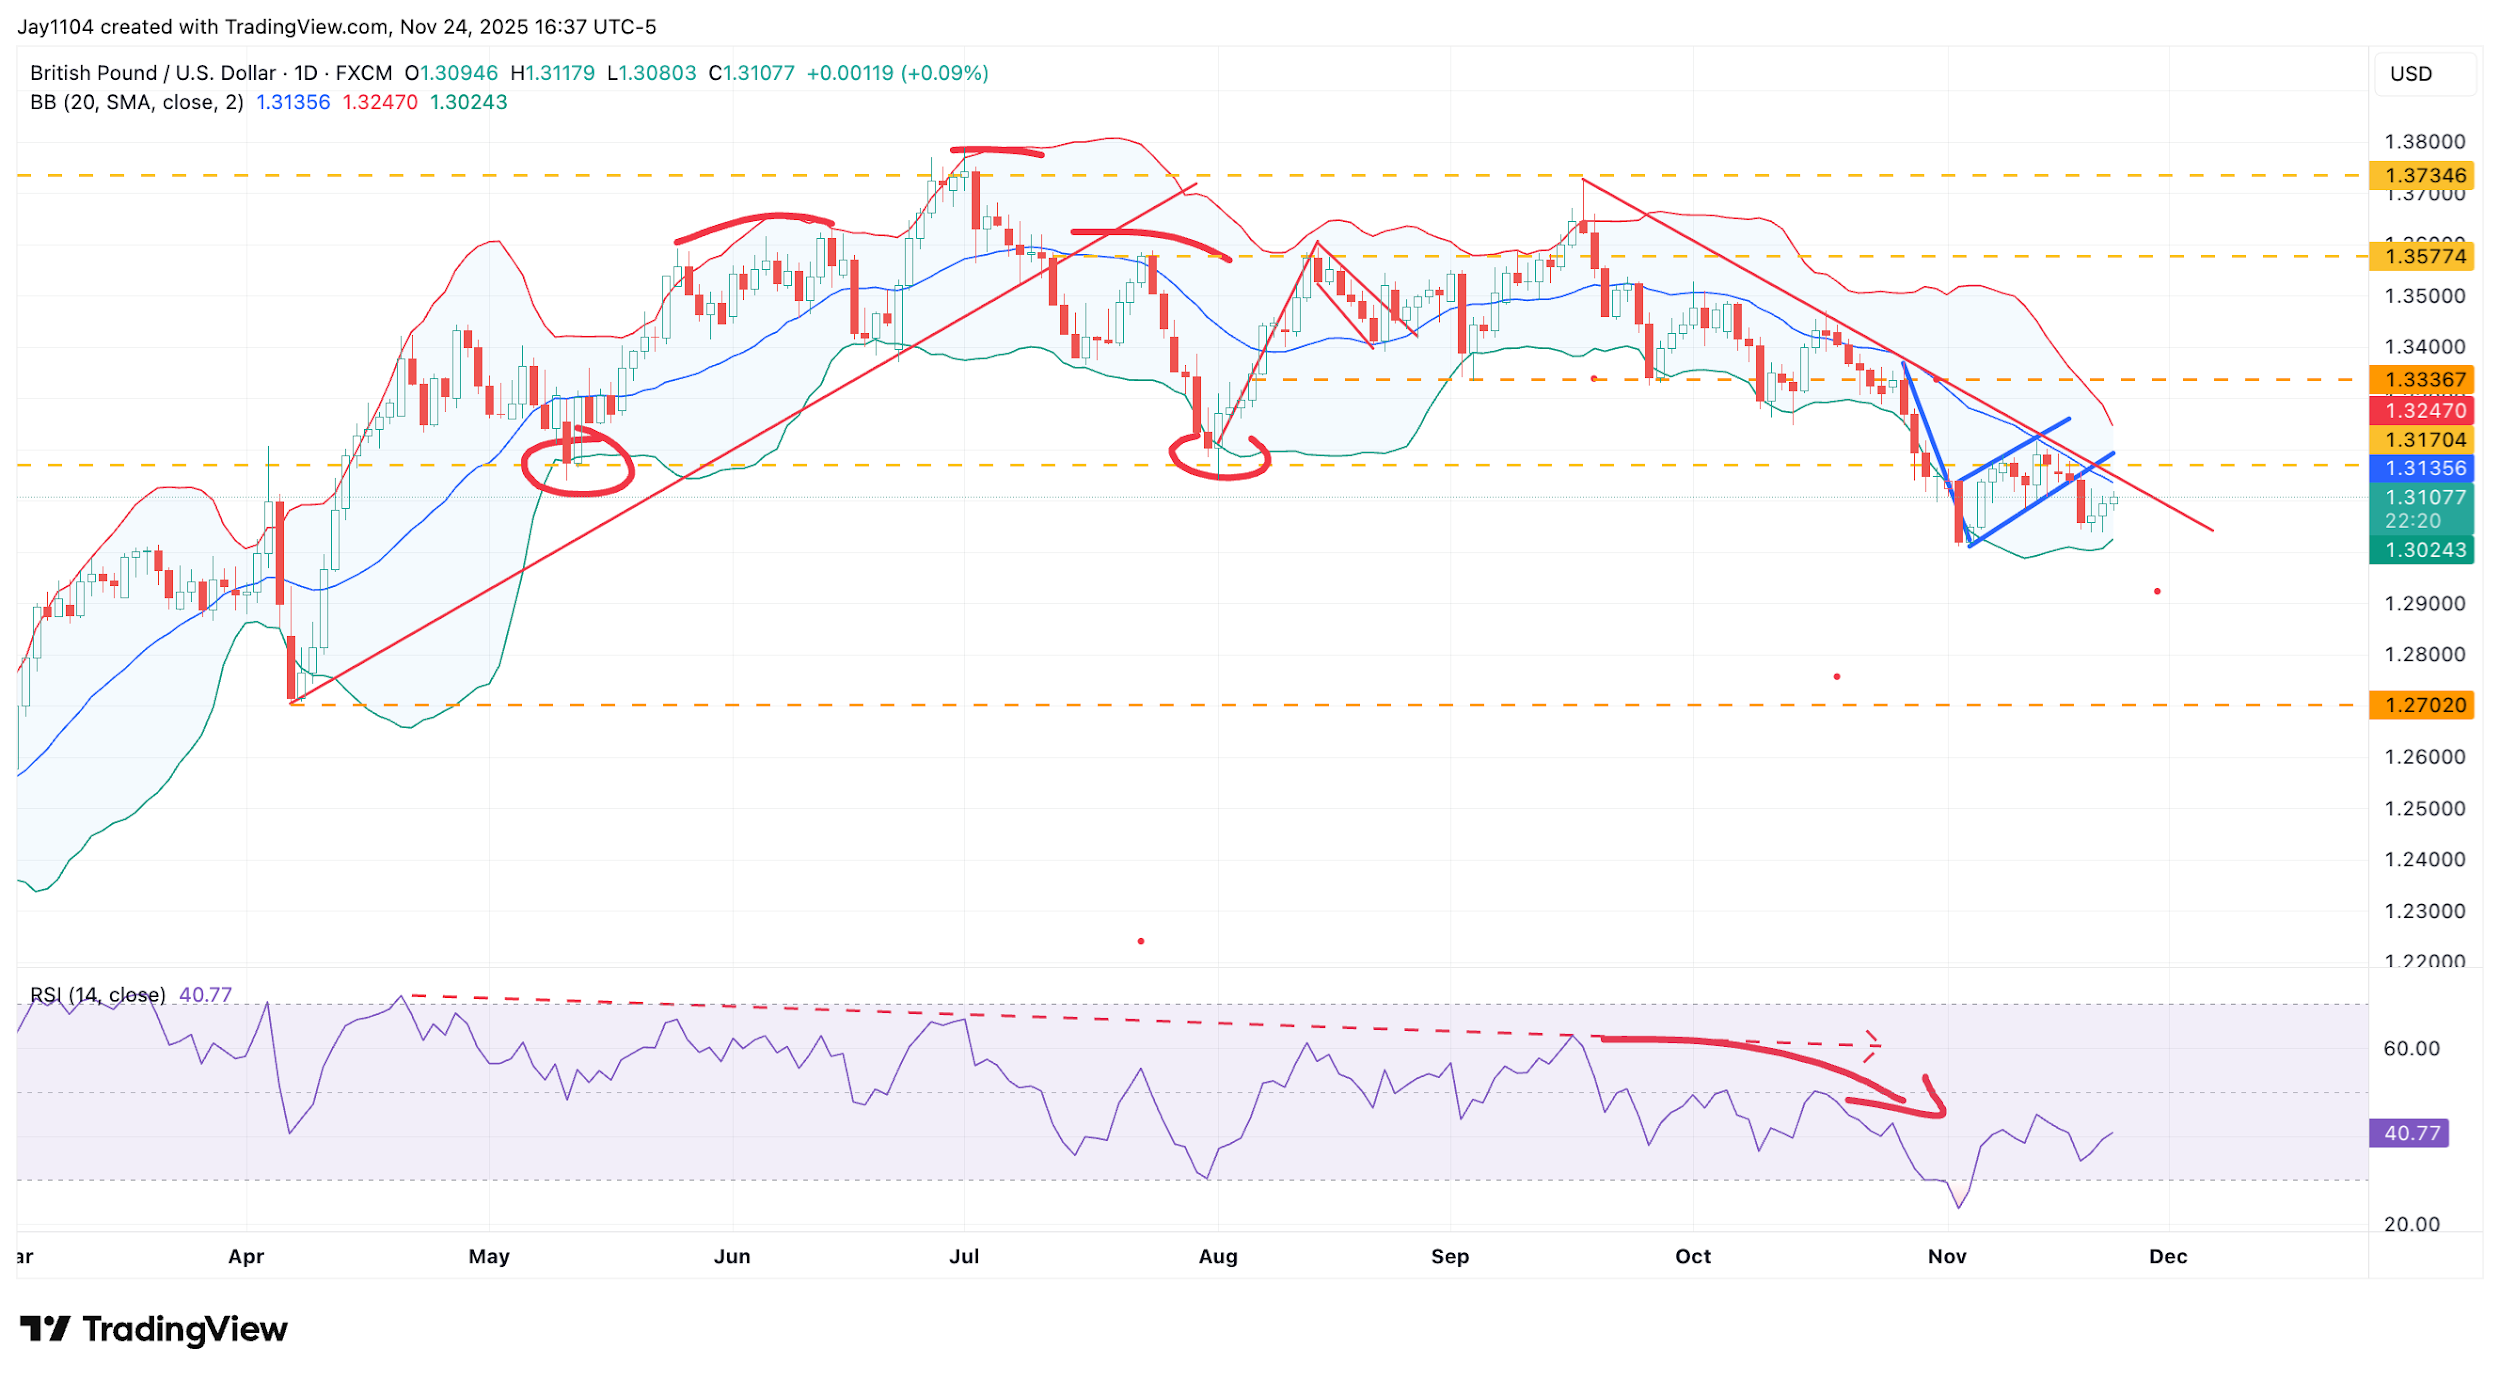
(Source: TradingView)
Past performance is not a reliable indicator of future results.
Oil Nears A Breakout Again
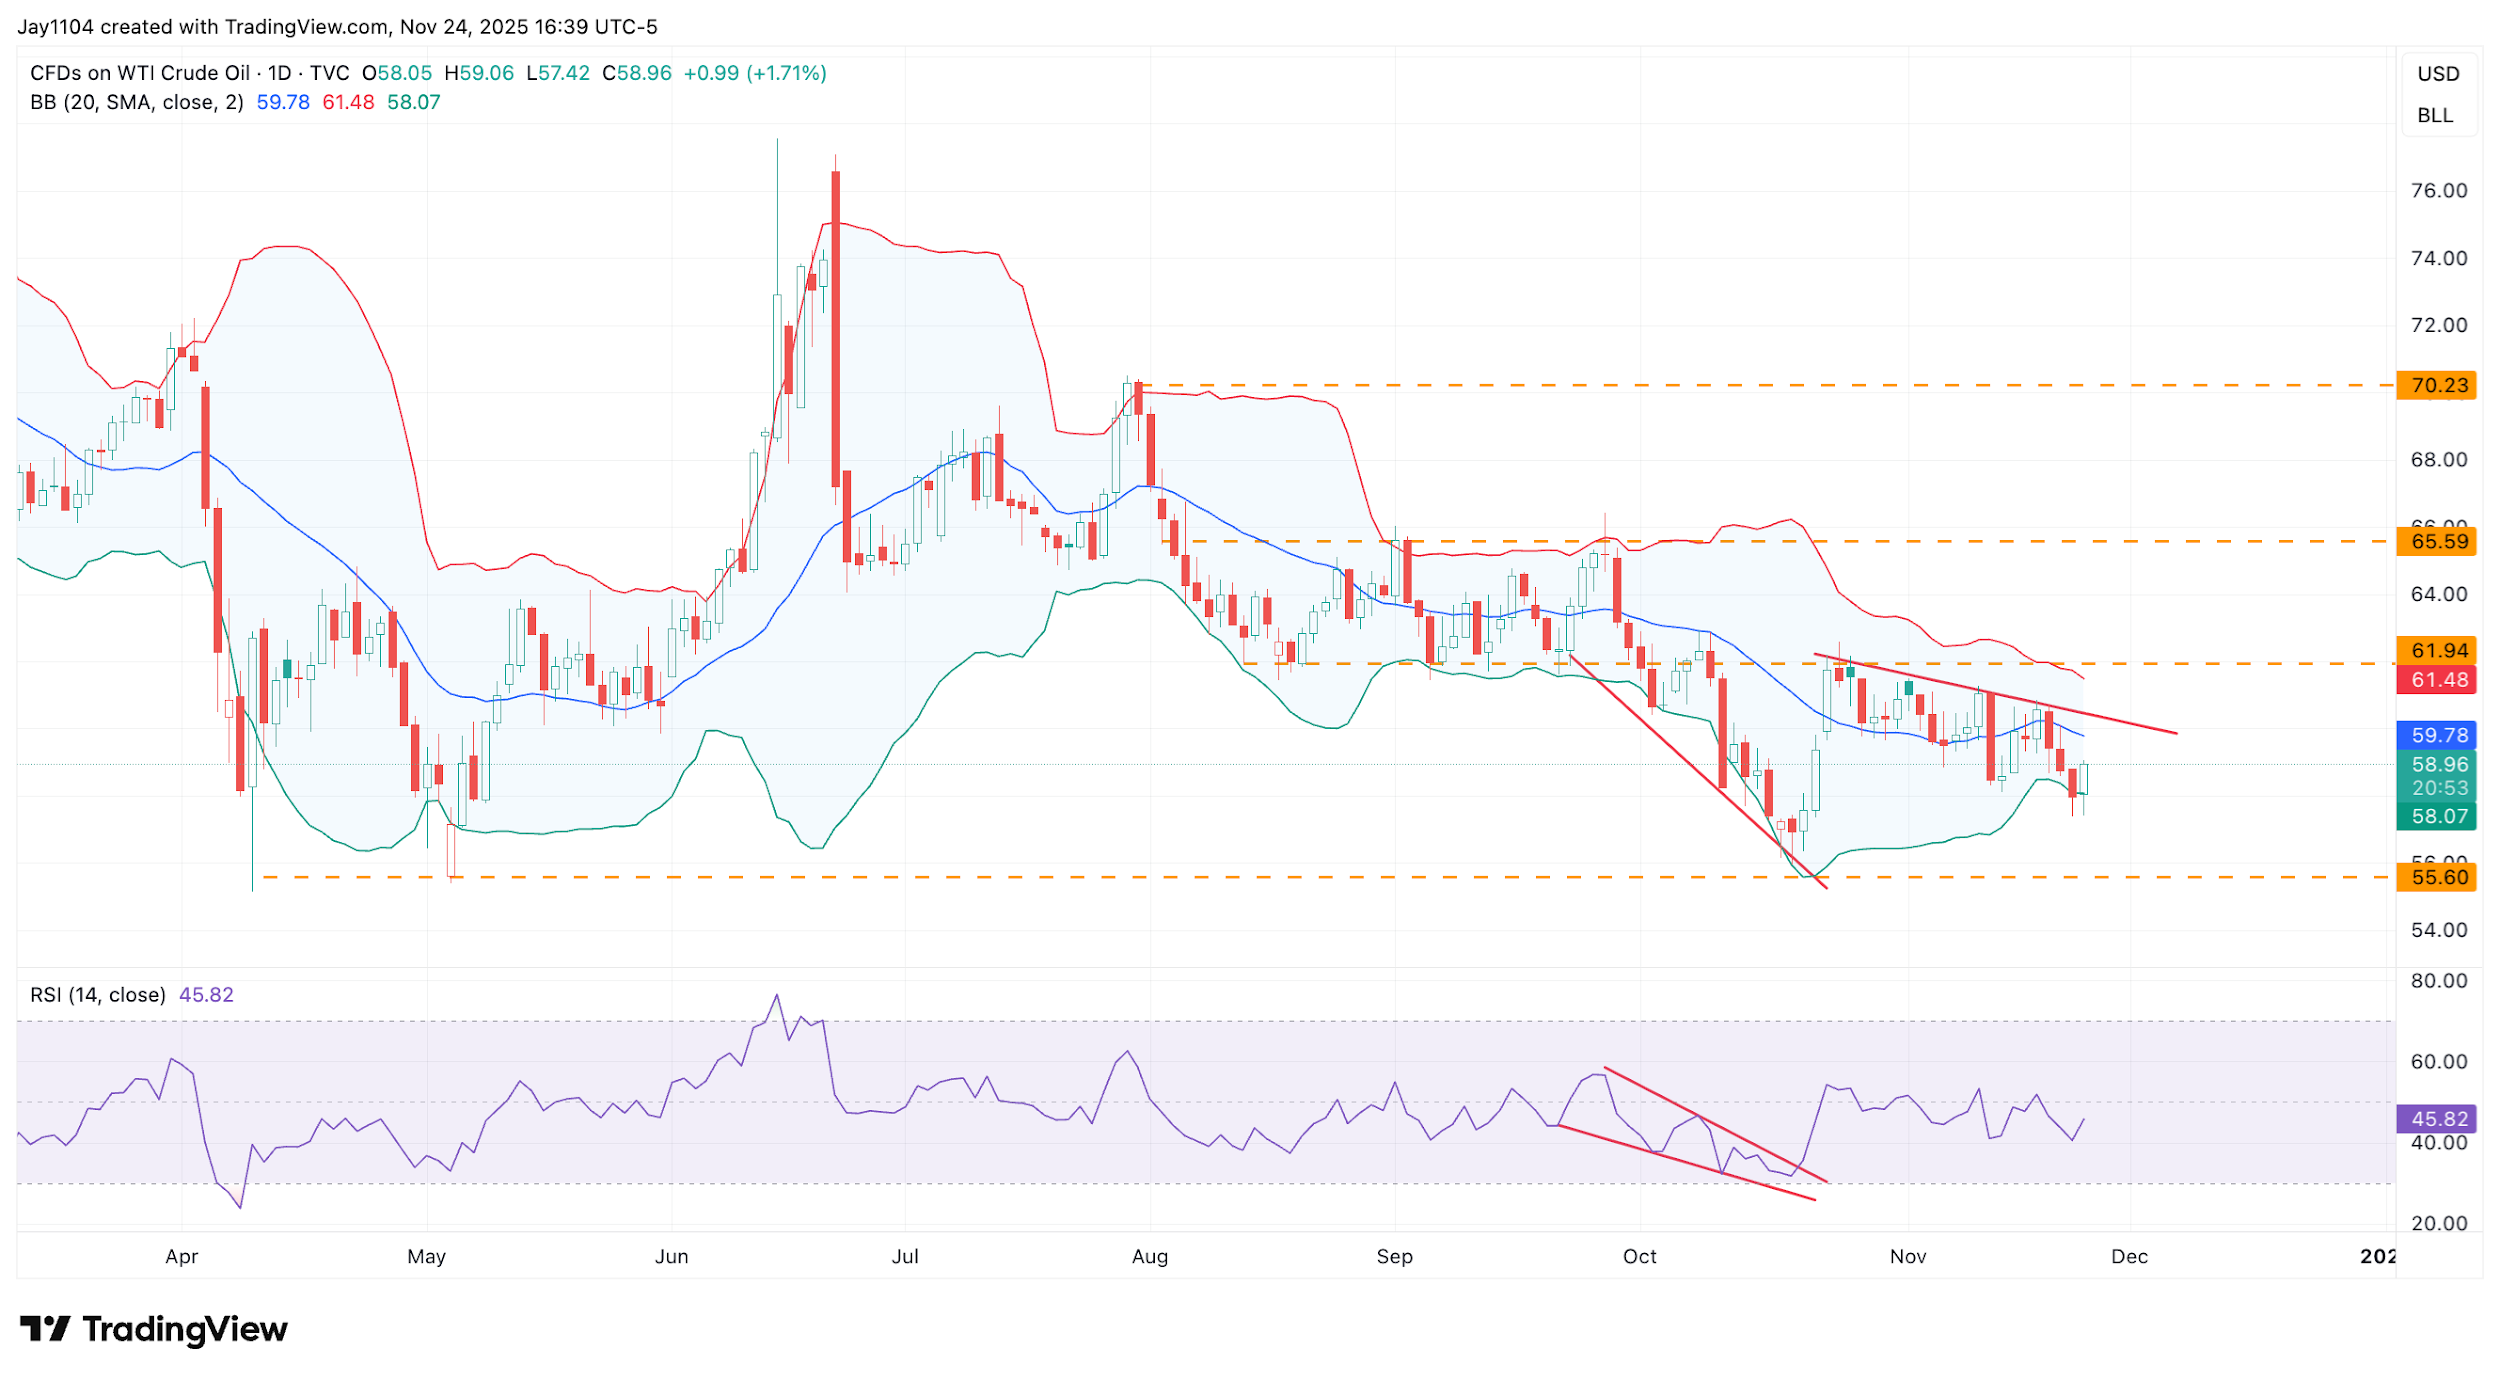
WTI oil appears poised to break out and move higher. [Chart6] We have seen similar setups before, but it now looks as though prices are moving back up towards a downtrend that dates back to June of this year. A breakout above this trend line at around $60 could push oil prices towards roughly $62, although this will depend largely on whether resistance at the trend line can be cleared. Encouragingly, momentum has been improving.
(Source: TradingView)
Past performance is not a reliable indicator of future results.