Rising wedge pattern: a comprehensive guide to trading reversals
Spotting a trend is one thing, but knowing when that trend is about to reverse can be tricky. That’s where real trading skills come in. A rising wedge pattern is a technical chart pattern that helps identify a potential reversal in an asset's price. Knowing how to spot this pattern can prevent you from chasing a trend till it is too late or help you enter a trend at the right price. Remember, while chart patterns may give clues on potential price action to come, past performance is not a reliable indicator of future results.
What is a rising wedge pattern?
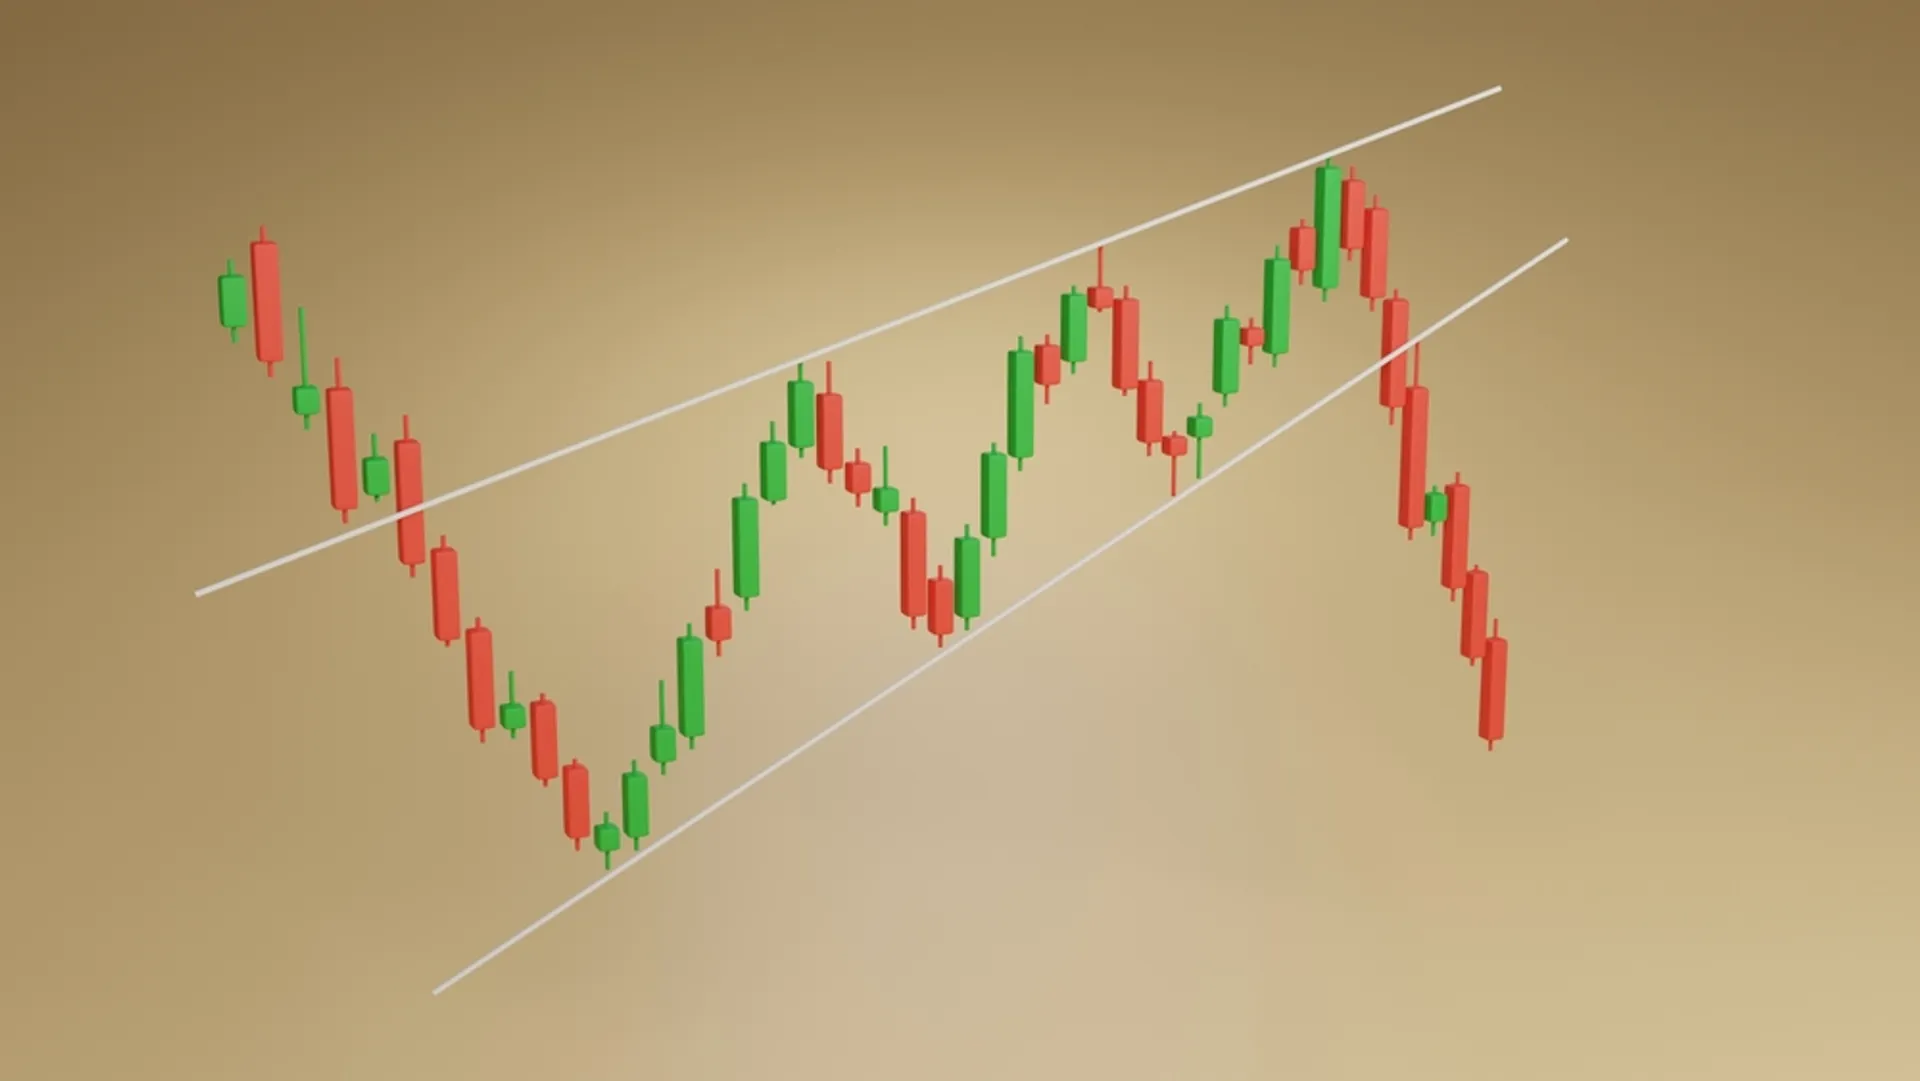
A rising wedge pattern is a technical chart formation that signals a potential reversal in an asset's price. Visually, it has 2 upward-sloping trendlines that converge (moving closer together towards a future point where they would meet). This pattern is relevant only when it appears during an uptrend. It can be used for predicting price movements in any asset class, including stocks, forex, and cryptocurrencies.
Past performance is not a reliable indicator of future results
Don’t confuse the rising wedge with a channel or triangle pattern. While a rising wedge needs the upper and lower trendlines to converge, a triangle pattern has one trendline that is flat and the other one sloping. A channel pattern has 2 parallel trendlines, which means they don’t converge.
Key characteristics of a rising wedge pattern
Here are some features that will help you identify a rising wedge pattern.
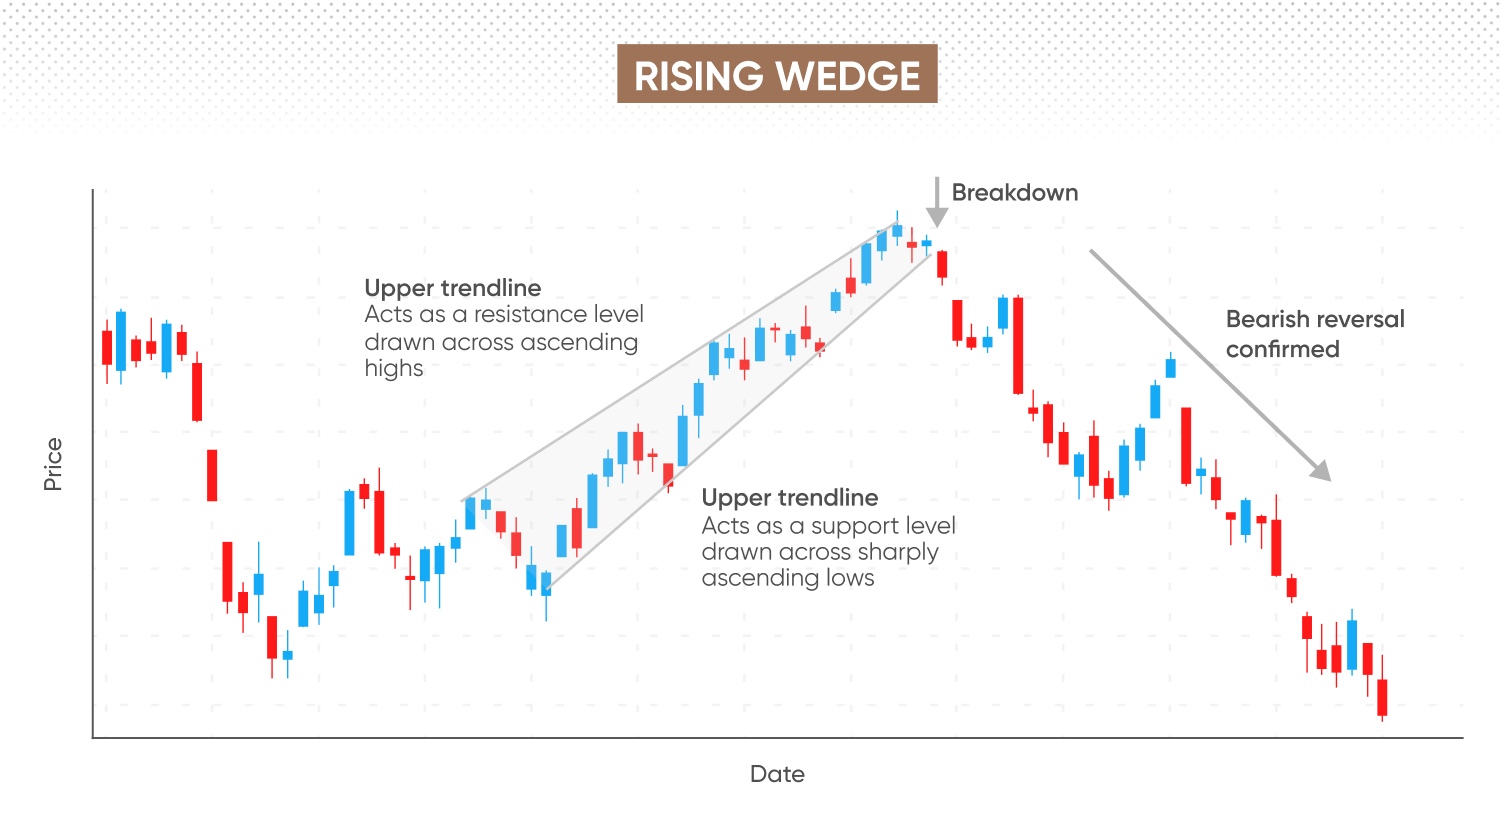
2 trendlines: the lower one is called support and the upper is known as resistance. This lower trendline links at least 2 consecutive higher lows, while the upper one connects 2 or more consecutive higher highs.
Convergence of trendlines: both lines slope upwards, but the slope of the lower trendline is steeper. This difference in steepness between the 2 trendlines is what causes them to converge and form a wedge.
Narrowing price range: the rising wedge pattern forming means that the range between the highs and lows is continuously becoming smaller with time.
Declining volume: a drop in volume is considered a sign of confirmation of the breakout.
Tilted upward slope: the entire pattern has an upward angle, although it’s a bearish reversal pattern.
Breakdown direction: the price breaking below the lower trendline is another confirmation of the pattern.
Rising wedge as a reversal pattern
The rising wedge is a bearish reversal pattern following an uptrend. The psychology behind this shift in momentum involves buyers losing strength as sellers gradually gain control.
Just imagine that the price of an asset is climbing. The highs and lows continue to be higher but the gap between the highs and lows is converging, indicating exhaustion among buyers. You can see this on charts when the two upward-sloping trendlines begin converging as price action continues. The price compression within the wedge reflects the struggle between buyers and sellers. The lower trendline being steeper indicates that buyers are pulling back sooner.
The decrease in volume is another giveaway, indicating fewer buyers are willing to buy at increasingly higher prices. It shows that the bullish enthusiasm is losing steam and the conviction in the trend is growing weaker.
When the price can no longer sustain the upward trajectory and finally breaks below the lower trendline, it’s a strong signal that sellers have taken control. This breakdown often occurs with increased volume, confirming the shift in sentiment and the beginning of a downtrend.
Rising wedge as a continuation pattern
While the rising wedge can be seen as a bearish reversal signal, it can appear as a continuation pattern, although this happens less frequently. If you see the pattern appearing during a downtrend, it signals a temporary pause or consolidation before the price resumes its downward trajectory. In this scenario, the rising wedge indicates a small rebound in prices without any change in the overall bearish sentiment. The upward sloping trendlines and decreasing volume just mean that the sellers are taking a breather.
The key message here? It’s not enough to spot a rising wedge pattern. You need to consider the context. The direction of the trend before the pattern is formed is most crucial. If you see it in a chart where the asset is in a downtrend, interpret it as a bearish continuation. It’s only when the pattern is formed in an uptrend, that you should consider it a bearish reversal signal.
How to identify a rising wedge on a chart
Identifying a rising wedge correctly takes a bit of skill and a lot of practice. Here are some steps to remember.
- Identify an asset that is on an uptrend.
- Look for at least 2 clear swing highs and 2 clear swing lows, as these will become the anchors for drawing your trendlines.
- Remember: both the highs and the lows should be progressively higher.
- Connect 2 consecutive swing highs with a straight line. This line is your upper trendline. It should slope upwards.
- Tip: the pattern is stronger if you have more than 2 swing highs.
- Connect 2 consecutive swing lows with another straight line. This is your lower trendline and should also slope upwards but make a steeper climb.
- Yes, you guessed right. The pattern is potentially stronger if you have more than 2 swing lows.
- Now it’s time to confirm convergence, which is the most important feature of the rising wedge pattern. Check whether the highs and lows are becoming narrower.
- Verify the wedge shape.
Your charting platform would probably offer drawing tools. If you’re trading on MT4 or MT5, simply click ‘insert’ in the top navigation bar and choose ‘Objects’ and then select ‘Trendline’.
Zooming in and out of the chart can sometimes help you identify the most accurate swing points for trendline placement.
Common mistakes to avoid in pattern detection
Knowing the common mistakes helps you avoid making wrong trading decisions.
- Confusing parallel channels with rising wedge. For a wedge, the lines must converge.
- Mistaking ascending triangles for rising wedge. Seeing a flat or horizontal trendline? It’s not a rising wedge, where both lines slope upwards.
- Identifying a wedge before enough price points have formed. Patience is key here. Do wait for at least 2 consecutive swing highs and lows.
- Ignoring volume is another common mistake. Declining volume during the pattern's formation is an important confirmation.
- Trading before a breakout. Wait for the price to break below the lower trendline.
Volume analysis in rising wedge
Volume analysis is critical for confirming the accuracy with which you have identified a rising wedge pattern. The wrong volume readings can trigger false signals, leading to unprofitable trades. There are 2 places where volume matters in the rising wedge pattern. First look for declining volume while the pattern is being formed. This diminishing volume indicates that the bulls are reducing their capital commitment for this asset, resulting in a weakening of buying pressure. This reduction in liquidity suggests that the upward momentum will soon become unsustainable.
Once the pattern is formed and the price breaks out, check the volume. A surge in volume means that sellers are coming in with strength. Without selling pressure, the asset will not go into a downturn. An increase in trading volume at the point of a breakout is a powerful confirmation signal. Weak volume at breakout can lead to a ‘whipsaw’, with the price quickly resuming the previous uptrend.
How to trade the rising wedge pattern
You’ve identified the pattern correctly. What next? Let’s look at some important decisions you’d need to make to trade this pattern.
Deciding entry points
When to open a position? The breakout below the lower trendline is considered a good entry point. Remember to check for the spike in volume, without which the downtrend may not hold. The breakout means that sellers have gained control and the pattern is completing.
If you wish to follow a more conservative approach, wait for a retest of the broken support line (the lower trendline) before entering. After the initial breakout, the price often pulls back to retest the newly formed resistance level. If the price rejects that level, it provides a second confirmation of the downtrend being sustainable. Don’t worry if the volume is low at this point. This is often the case, as there are fewer buy orders to test the new resistance level.
Placing stop-loss
Placing a stop-loss order is crucial for managing risk and protecting capital. When going short after a bearish reversal signal, experienced traders typically place their stop-loss just above the upper trendline of the rising wedge. Alternatively, you can place it above the last significant swing high within the pattern, especially if that high was above the upper trendline. The rationale here is that if the price moves back above the upper trendline, it invalidates the rising wedge pattern and you may be better off exiting the trade to minimise losses.
Setting profit targets
Determining exit points for profits is as important as identifying the right entry points. There are a few take-profit strategies that you may consider.
Height projection method: involves measuring the widest part of the wedge (vertical distance between the upper and lower trendlines at the beginning of the pattern's formation) and using that distance from the breakout point to set the price target.
Previous support levels: identify significant prior support levels below the breakout point as take-profit targets.
Multiple target levels: setting the first target at a previous support level or by using the height projection method. Then placing subsequent targets at Fibonacci extension levels. Sometimes experienced traders set up multiple targets so that they can close a portion of their position at the first target and let the rest run.
Combining with technical indicators
To make better trading decisions, avoid relying on one pattern. It’s best to refine your entry and exit signals by using technical indicators. Here are the indicators that are commonly combined with the rising wedge:
RSI divergence: occurs when the price makes higher highs within the wedge, but the RSI makes lower highs. This is a powerful early warning sign of weakening momentum and strengthens the bearish outlook of the wedge.
MACD (moving average convergence divergence): a move below the zero line can provide additional confirmation of weakening bullish momentum before or during the wedge formation.
Fibonacci levels: used for identifying potential support levels (take-profit targets) below the breakout point.
Real market examples of rising wedge
Through June and July 2020, gold prices rallied but the range kept becoming narrower, forming a rising wedge. Gold price broke out at $2,035 on August 10 and continued to decline through the month. The yellow metal closed August 2020 below $1,930.
The USD/JPY formed a rising wedge from March 3 to March 10, 2025. The breakout took place on March 11 at 0.6789. The forex pair continued to decline through the rest of the month hitting a low of 0.6618 on April 27, 2025.
Shares of Abbott Laboratories rallied from October 2022 through January 2023, with highs and lows converging through this period. The rising wedge led to a breakout on January 13, at $113.50. The share price declined sharply through the next couple of months to reach a low of $96.96 on March 10, 2023.
Past performance isn’t a reliable indicator of future results.
Best practices for trading rising wedges
While the rising wedge can be a potential bearish reverse pattern, smart trading requires you to follow the best practices to increase reliability and mitigate risks.
Don’t trade without confirmation
- Check for a drop in volume when the wedge forms
- Wait for a clear breakout below the lower trendline
- Verify whether the breakout is taking place with a surge in trading volume
Trading prematurely increases the risk of false breakouts, where the price temporarily breaks out only to reverse back into the previous trend, leading to losses.
Match with broader market context
No chart pattern should be viewed in isolation. Always assess the rising wedge within the context of the broader market trend, relevant news, and technical analysis. For instance, a bearish rising wedge is more potent if the overall market is also showing signs of weakness.
Choose the appropriate timeframe
The reliability of a rising wedge is lower on minute charts. The pattern is more reliable on higher timeframes, such as 1-hour, 4-hour, daily, and weekly charts. Patterns on shorter timeframes could be just noise, resulting in false signals.
Avoid relying purely on mechanical measurements
Trading is not an exact science. Some discretion is often necessary. For instance, if more price points appear close to your trendline, the rising wedge is considered more reliable. Similarly, in a highly volatile market, the pattern forming is less reliable. Also consider the broader market sentiment and stay abreast of news.
Strengths and limitations of rising wedges
Like all technical analysis patterns, the rising wedge comes with its own set of strengths and limitations that traders must be aware of.
Strengths
Clear breakout logic: the rising wedge has a clear and actionable breakout logic. The pattern typically signals a breakdown below the lower trendline, providing a straightforward entry point for short positions.
Works across markets and timeframes: the rising wedge is a versatile pattern that can appear across financial markets, including stocks, forex, cryptocurrencies, and indices. Also, it can be identified and traded on various timeframes, from intraday charts for scalping to daily and weekly charts for swing trading and position trading.
Limitations
False breakouts: the pattern is susceptible to false breakouts, especially without volume confirmation. Price can temporarily dip below the lower trendline before resuming the prior upward trajectory, trapping traders who failed to wait for confirmation of strong volume at breakout.
Subjectivity in drawing trendlines: drawing the trendlines for a rising wedge involves a degree of subjectivity. Different traders might connect swing highs and lows slightly differently, leading to variations in the interpretation of the pattern. This subjectivity can make precise identification challenging for novice traders, which highlights the importance of practising on a demo account.
Rising wedge vs. other patterns
Some chart patterns look similar to the rising wedge. This can be confusing for new traders. Misidentifying a pattern can lead to incorrect price predictions.
Falling wedge:
- inverse counterpart of the rising wedge.
- characterised by 2 downward-sloping, converging trendlines.
- bullish reversal pattern, often leading to an upward breakout.
- signifies that selling pressure is diminishing and buyers are taking control.
Ascending triangle:
- can be a continuation or reversal pattern
- involves convergence, but its structure is different from a rising wedge.
- has a flat or horizontal upper trendline, which represents a resistance level, and an upward-sloping lower trendline, representing rising lows.
- is a bullish pattern, indicating accumulation and often leading to an upward breakout above the flat resistance.
Here’s a table for a quick view of the differences between the rising wedge and the ascending triangle.
| Feature | Rising wedge | Ascending triangle |
|---|---|---|
| Upper trendline | Slopes upward | Flat or horizontal (resistance) |
| Lower trendline | Slopes upward | Slopes upward (higher lows) |
| Overall shape | Narrowing, upward-tilted wedge | Right-angled triangle (horizontal top) |
| Convergence | Both trendlines converge | Price converges towards flat resistance |
| Typical breakout | Downward (bearish reversal/continuation) | Upward (bullish continuation/reversal) |
| Volume during formation | Decreasing | Decreasing (often surges on breakout) |
Types of traders using the rising wedge
The pattern is used by different types of traders. Scalpers and intraday typically monitor charts of shorter timeframes, like the 5-minute or 15-minute charts, for quick, short-term trades. However, patterns on these lower timeframes are generally more susceptible to false signals, requiring tighter risk management and quicker reactions. Day traders use timeframes like 1-hour and 4-hour charts, which are better for a more reliable pattern formation. The pattern is often used in swing trading, where trades are held for several days to weeks. On daily charts, the signals tend to be more reliable.
Summary and key takeaways
The rising wedge pattern is a powerful and versatile chart formation that helps traders identify bearish reversals. Look for the pattern after an uptrend, as this signals that buyers are losing steam and a downtrend may begin.
Here is a quick checklist for identifying a rising wedge:
- appearing during an uptrend
- 2 upward-sloping trendlines that are converging.
- declining trading volume during the pattern's formation.
- use other technical indicators for confirmation.
Wait for a breakout below the lower trendline, ideally one that is accompanied by a surge in volume. Consider waiting for a retest of the broken trendline for a more conservative entry. Place the stop-loss just above the upper trendline of the wedge or above the last significant swing high within the pattern.
The rising wedge is a frequently occurring chart pattern. So, you need to be careful when identifying it. Stay abreast of overall market sentiment and news as no chart pattern or technical indicator is infallible. A disciplined approach, stringent risk management, and confirmation are paramount in leveraging the predictive power of the rising wedge pattern in the financial markets.