A trader’s guide to US natural gas

Learn all about natural gas and its price history, as well as how to trade it via CFDs on Capital.com.
What is natural gas?
Natural gas is a fossil fuel formed millions of years ago from the remains of dead animals and plants. Today, it’s a crucial energy commodity, playing a significant role in electricity generation and serving as an affordable and efficient fuel for industries, governments, and households. Its versatility also makes it a key player in heating, cooking, and powering industrial operations.
US natural gas is actively traded on futures markets, such as the NYMEX, and through contracts for difference (CFDs). Traders speculate on price movements influenced by supply-demand dynamics, geopolitical events, weather patterns, and economic factors, making it a key asset in energy trading.
When you trade commodities with Capital.com, you’re using CFDs. This means you don’t own the underlying asset itself – instead, you speculate on its price movements, through markets such as US natural gas. CFDs are traded on margin and involve leverage, which can magnify both profits and losses.
What affects the natural gas price?
A variety of factors shape both the supply of and demand for natural gas within the global economy, often resulting in notable price movements that attract close attention from commodity CFD traders. Here are some key influences:
Production levels
Changes in natural gas production can affect its overall availability, which in turn may impact prices. Increases in output typically ease supply pressures, while disruptions or declines can have the opposite effect.
Infrastructure development
Developments and expansion of pipelines and LNG terminals can enhance the efficiency and reach of natural gas transportation, helping to facilitate supply. However, bottlenecks or delays in infrastructure projects may restrict availability and influence pricing.
Exploration success
Discoveries of new gas reserves or advancements in extraction technologies may increase future supply. While this may place downward pressure on prices if supply outpaces demand, the impact can be gradual and depends on broader market conditions.
Economic growth
Periods of economic expansion may coincide with greater industrial and residential demand for natural gas, which can push prices higher. Conversely, economic slowdowns tend to reduce consumption, potentially moderating price growth or even leading to declines.
Weather patterns
Weather has a short-term influence on demand. Colder winters or hotter summers have historically led to increased use of heating or cooling, driving fluctuations in natural gas prices.
Global energy policies
Government policies and international agreements aimed at reducing carbon emissions or promoting alternative energy sources can alter demand patterns over the longer term. Such shifts may gradually affect the role of natural gas within the global energy mix.
Natural gas price history
Here’s a chart of the natural gas price history over the past few years, showing the key events that contributed to its fluctuations.
Past performance is not a reliable indicator of future results. Share prices are indicative and may differ from live market prices.
Major natural gas price movements in recent years
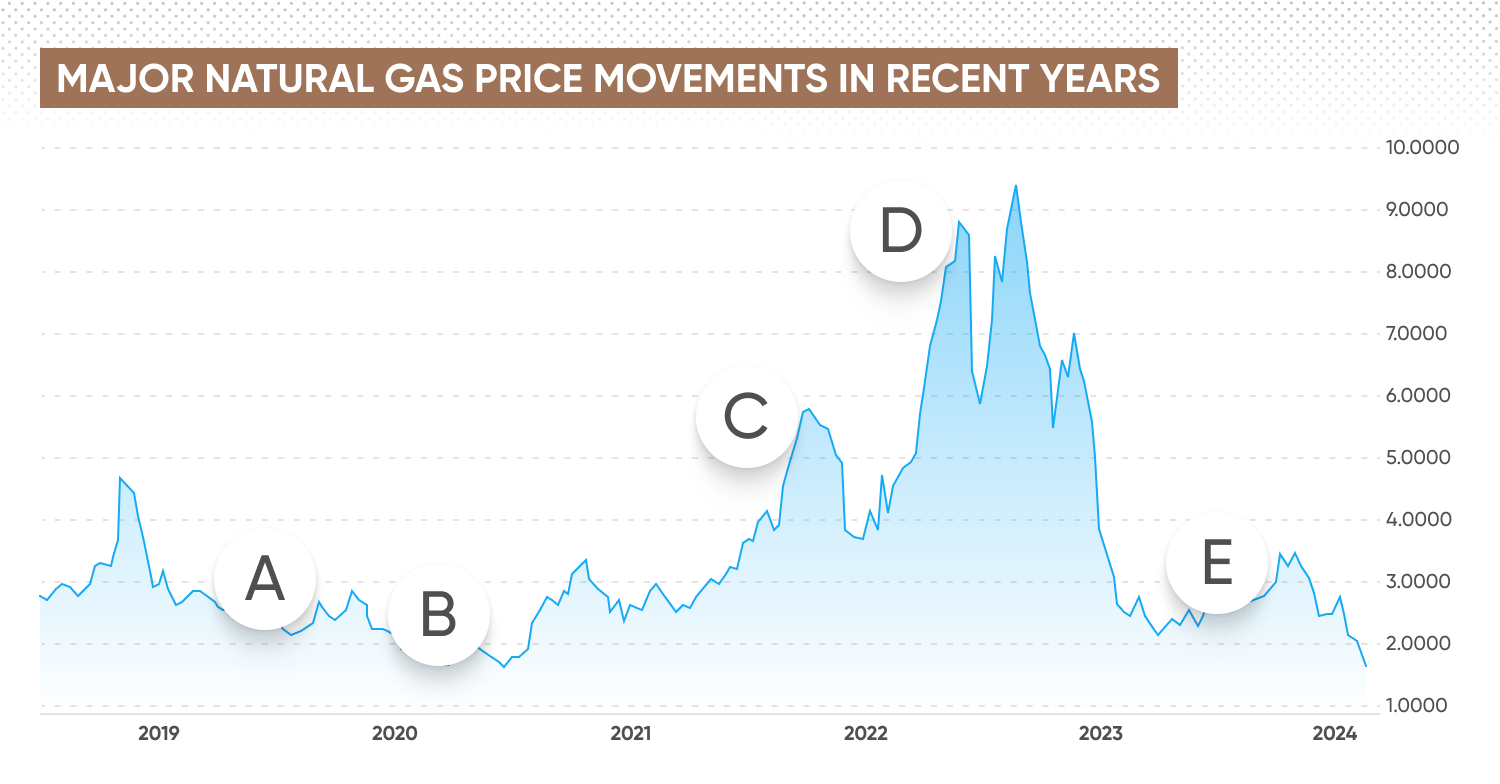
Past performance is not a reliable indicator of future results.
A: 2019 – supply decline and mild weather
Natural gas prices fell to around $2 per million British Thermal Units (MMBtu), due to elevated US production levels, mild weather conditions, and increased storage inventories, all of which placed downward pressure on prices.
B: COVID-19 pandemic (2020)
The outbreak of Covid-19 led to widespread lockdowns, travel restrictions, and global economic slowdowns. Industrial activity contracted, reducing energy consumption and overall demand for natural gas. US natural gas fell below $1.60 per MMBtu during this period.
C: Post-pandemic recovery (2021)
Demand for natural gas rebounded as economies began to recover from the pandemic’s initial shock, influencing prices to rise above the $6 per MMBtu mark.
D: Geopolitical tensions (2022)
A volatile year for natural gas marked by Russia’s military action against Ukraine, along with associated supply restrictions and sanctions, caused significant uncertainty in energy markets. Heightened demand during a colder-than-average winter pushed prices above $9 per MMBtu. Later in the year, efforts by governments and businesses to rapidly replenish LNG storage led to an oversupply, which contributed to prices falling back to around $5 per MMBtu.
E: Relative stability (2023): Following the turbulence of 2022, natural gas prices in 2023 were comparatively stable, averaging $2.53 per MMBtu for much of the year.
Sources: Capital.com, Yahoo Finance. Past performance is not a reliable indicator of future results.
What are the natural gas trading hours?
Natural gas trading hours vary depending on the exchange. On the NYMEX (New York Mercantile Exchange), natural gas futures trading runs from 10pm to 9am UTC, Sunday through Friday. Other platforms, including those offering CFDs or spot trading, may operate on different schedules. It’s important to check the trading hours for your specific platform in UTC. These extended hours provide traders with nearly round-the-clock access, allowing them to respond quickly to global market developments.
How to trade natural gas
You can trade natural gas by speculating on its spot price, or by using futures, terms we’ll explain below. With CFDs, you can take a position on natural gas price movements without owning the underlying asset. If you anticipate the price will rise, you may take a long (buy) position; if you expect it to fall, a short (sell) position may be appropriate. This flexibility allows traders to respond to a range of market outlooks.
To inform your trading decisions, you could apply fundamental analysis, technical analysis, or a combination of both to interpret price action and market sentiment. However, past performance isn’t a reliable indicator of future results, and effective risk management is key. Use tools such as stop-loss* and take-profit orders to manage your exposure.
Trading strategies include day trading, where multiple positions are opened and closed within a single day – and swing trading, which involves holding positions over days or weeks. US natural gas CFD trading strategies may involve using fundamental or technical analysis, or a combination of both, to make sense of price action – using tools such as RSI, MACD or Fibonacci retracements to assist in determining potential entry and exit points.
Discover more CFD trading strategies
*A standard stop-loss order isn’t guaranteed and may be subject to slippage if the market moves rapidly or gaps. However, a guaranteed stop-loss order (GSLO) is available, which ensures your position is closed at your specified level regardless of market volatility. Please be aware that a GSLO incurs an additional fee if triggered.
Trading natural gas on the spot market
When trading natural gas on the spot market, you are trading at the current market price (the spot price) for immediate settlement. This involves speculating on the present price of natural gas, which is influenced by supply and demand. You can trade CFDs based on the spot price, allowing you to take long or short positions with leverage without owning the physical asset. Leveraged trading amplifies losses and gains.
Trading natural gas with futures
Futures contracts involve agreeing to buy or sell natural gas at a specified price on a future date. These are standardised contracts traded on exchanges like NYMEX. Futures allow you to hedge or speculate on future price movements, with an obligation to settle at the contract's expiration unless closed out earlier. Unlike spot trading, you’re speculating on where prices will be at a set date in the future.
Why trade natural gas with CFDs?
Trading natural gas with CFDs offers several advantages and risks. CFDs allow traders to speculate on natural gas price movements without owning the physical asset, offering flexibility and lower upfront capital requirements. They are traded on margin, which involves leverage. Leverage magnifies your potential losses, as well as potential gains.
CFDs also allow you to go long or short, enabling you to benefit from both rising and falling markets. Additionally, natural gas CFDs provide access to global markets without the logistical challenges of physical delivery.
Learn more about CFD trading.
Natural gas trading strategies
A range of trading strategies are commonly applied in the natural gas market, each designed to respond to different market conditions. Here are examples of two common approaches: breakout trading and range trading.
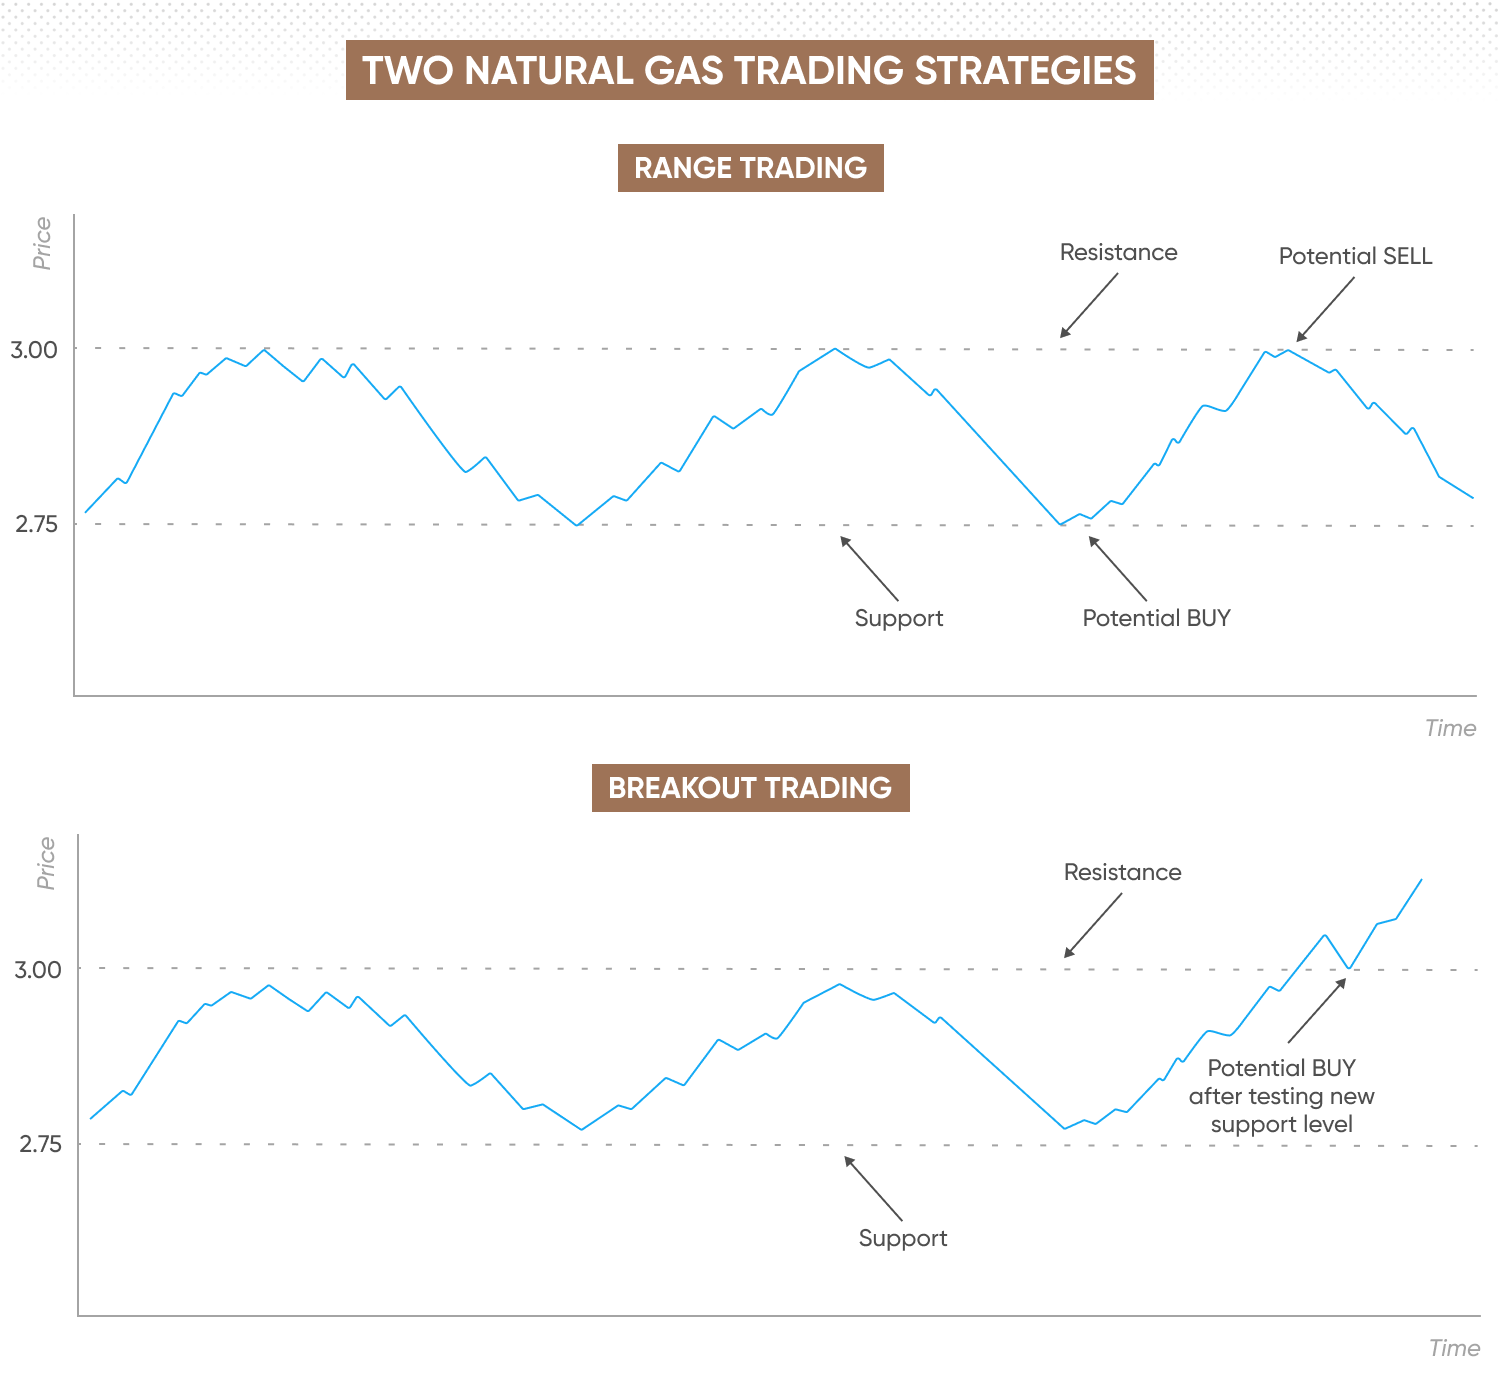
Breakout strategy example
Let’s say natural gas is trading at $2.80 with support at $2.75 and resistance at $3. A breakout strategy would involve opening a buy CFD position slightly above $3, expecting prices to surge higher once resistance is broken. If the price breaks above $3, a trader might target another rise to around $3.20. Conversely, should the price fall below support at $2.75, a sell order could be placed below this level, aiming for a potential decline towards $2.50.
Range trading example
If US natural gas is fluctuating between $2.75 and $3, a range trading strategy would involve buying CFDs at support near $2.75 and selling near $3. The goal is to profit from repeated price movements within this range. Traders typically place stop-loss orders just below support or above resistance to limit potential losses should the price break out of the established range. Conversely, if prices had approached resistance near $3.00, traders might aim to sell or take profits, anticipating a reversal back towards support.
FAQs
What factors influence natural gas prices?
Natural gas prices are influenced by a combination of supply and demand dynamics, which can be influenced by weather conditions, production levels, and geopolitical events. For example, colder winters increase demand for heating, while geopolitical tensions can disrupt supply. Additionally, storage levels and shifts in energy policy also play a role in natural gas price fluctuations.
Can I trade natural gas CFDs with leverage?
Yes, you can trade natural gas CFDs using leverage, which enables you to open a larger position with a smaller initial outlay. While leverage can increase potential profits, it also amplifies potential losses. As a result, leveraged trading carries a higher level of risk and is not suitable for all traders.
What is the difference between trading natural gas on the spot market vs futures market?
Trading natural gas on the spot market involves speculating on the current market price, with settlement taking place immediately or in the very near term. By contrast, futures contracts involve an agreement to buy or sell natural gas at a predetermined price on a specified future date, allowing participants to hedge or speculate on future price movements. CFDs offer exposure to both spot and futures prices without the need to own the underlying commodity. However, as CFDs are typically traded on margin, they involve leverage, which can magnify both gains and losses.