US labour data could give more context to a stronger-than-expected GDP in Q2
The US labour market is expected to have cooled in July as a stronger-than-expected Q2 GDP print surprised markets
The July U.S. Non-Farm Payrolls report due on Friday is expected to show a further cooling in the labour market. Expectations are for an increase of around 110,000 jobs, down from 147,000 in June. This would reflect a broader trend of decelerating job growth, consistent with the Federal Reserve’s goal of achieving a more balanced labour market. Some analysts expect even softer gains—closer to 95,000—citing a slowdown in government hiring. Meanwhile, ADP’s private payrolls data beat expectations with a 104,000 increase and, even though the correlation between both is usually weak, it could suggest the official report could land close to consensus.
Meanwhile, the unemployment rate is forecast to tick slightly higher to 4.2%, up from 4.1% last month. Average hourly earnings are expected to rise modestly, with annual wage growth anticipated at around 3.9%. Wage data will be closely watched, as strong wage growth could signal persistent inflationary pressures, while softer wage gains would reinforce the narrative of a cooling economy.
Beyond the headline numbers, structural labour constraints remain in focus. Factors such as declining immigration and an aging workforce are contributing to a slower expansion of the labour force. These supply-side constraints could put upward pressure on wages and limit long-term job growth even if demand remains steady.
This labour data holds significant implications for the Federal Reserve’s monetary policy. While most Fed officials currently expect to keep rates steady through the end of 2025, a notably weak jobs report could increase pressure on the Fed to begin cutting rates sooner. Conversely, a stronger-than-expected print could delay those expectations and support the U.S. dollar and bond yields.
Reassessing the Q2 GDP surprise
It is also important to factor in the GDP data released on Wednesday. In the second quarter, the US economy grew at an annualized rate of 3.0%, rebounding sharply from a 0.5% contraction in Q1 and beating expectations. However, looking closer at the data we can see that this rebound was heavily driven by a decline in imports—which subtract from GDP—rather than strong domestic demand.
Ultimately, the headline 3% figure as partly a mechanical swing tied to tariff-related front loading in Q1. Stripping out trade and inventory effects, underlying domestic activity appears much weaker. The tariff-driven buying frenzies in the beginning of the year have made it difficult to assess the underlying health and direction of the world’s largest economy. Businesses drawing from inventories rather than importing new goods gave GDP an artificial boost, obscuring weaker consumer and business spending fundamentals.
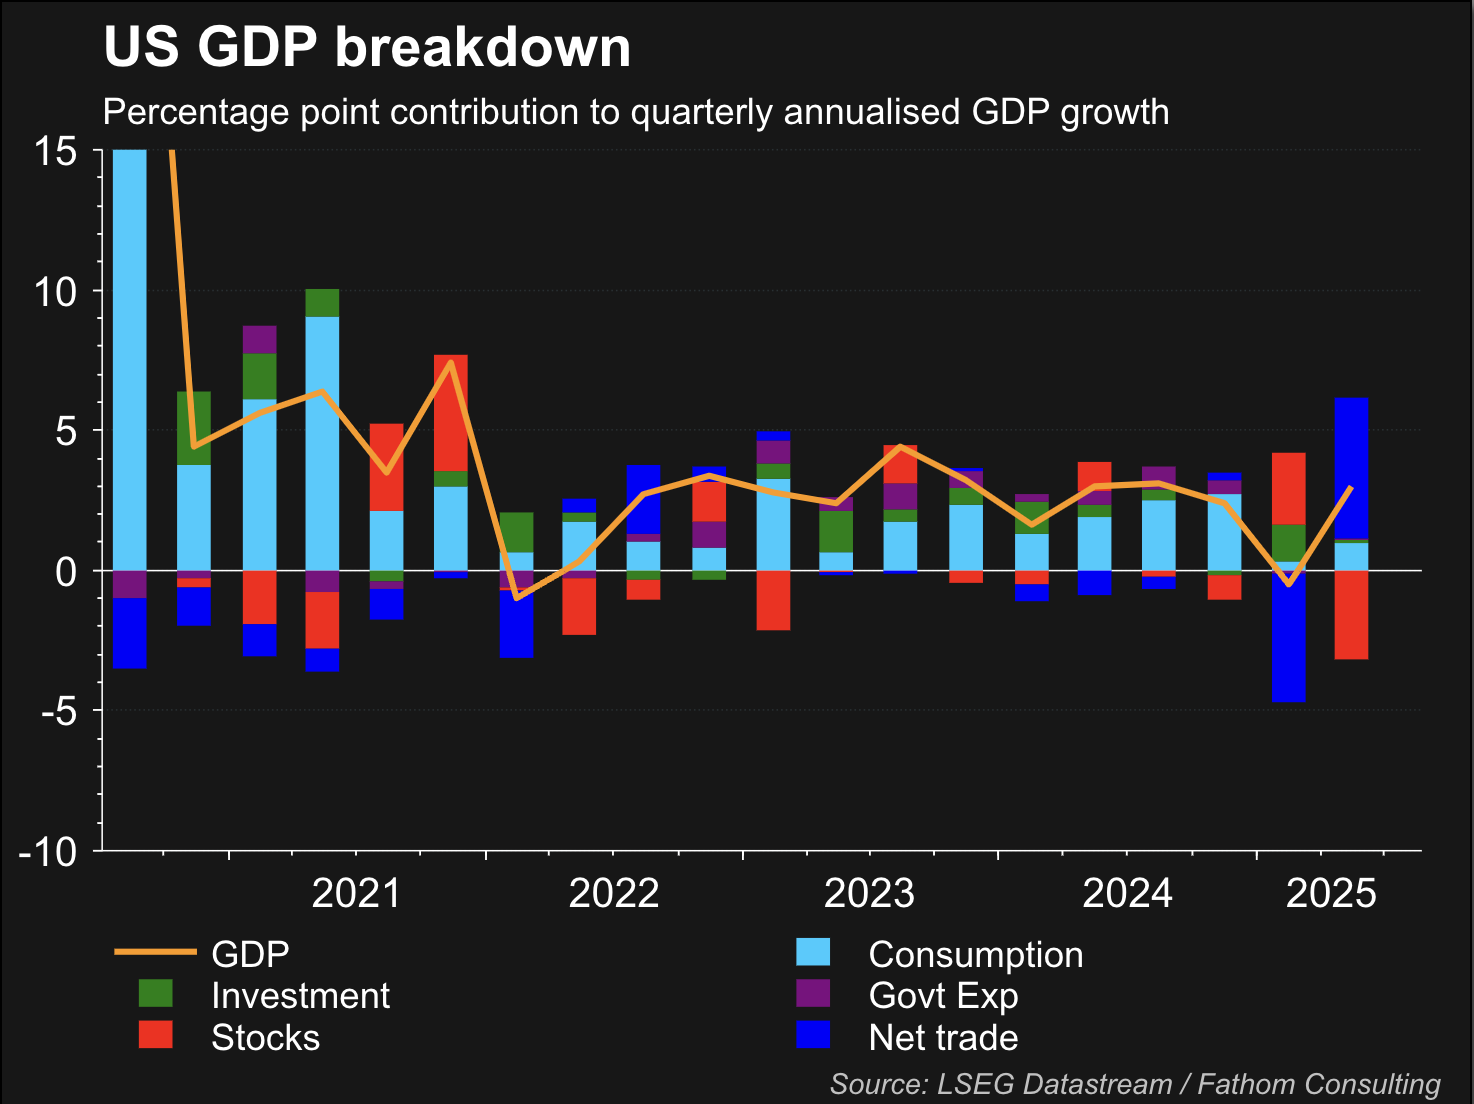
The strong—but contextually mixed—Q2 GDP print underscores a critical dynamic: the economy is showing signs of resilience, but the strength is uneven and likely to fade if structural weak points persist.
Friday's July Non‑Farm Payrolls (NFP) will thus be a key test: it could help clarify whether labour market momentum remains robust enough to support actual demand growth.
A soft NFP print, such as around 100,000 new jobs or less, would align with the subdued consumption and investment trends seen in GDP. Conversely, a stronger-than-expected jobs report (above 150k) would suggest the labour market remains firmer than top-line GDP implies and could sustain consumer spending despite broader headwinds.
Additionally, wage growth and participation metrics in the NFP report will provide insight into domestic demand strength that the headline GDP number struggled to capture.
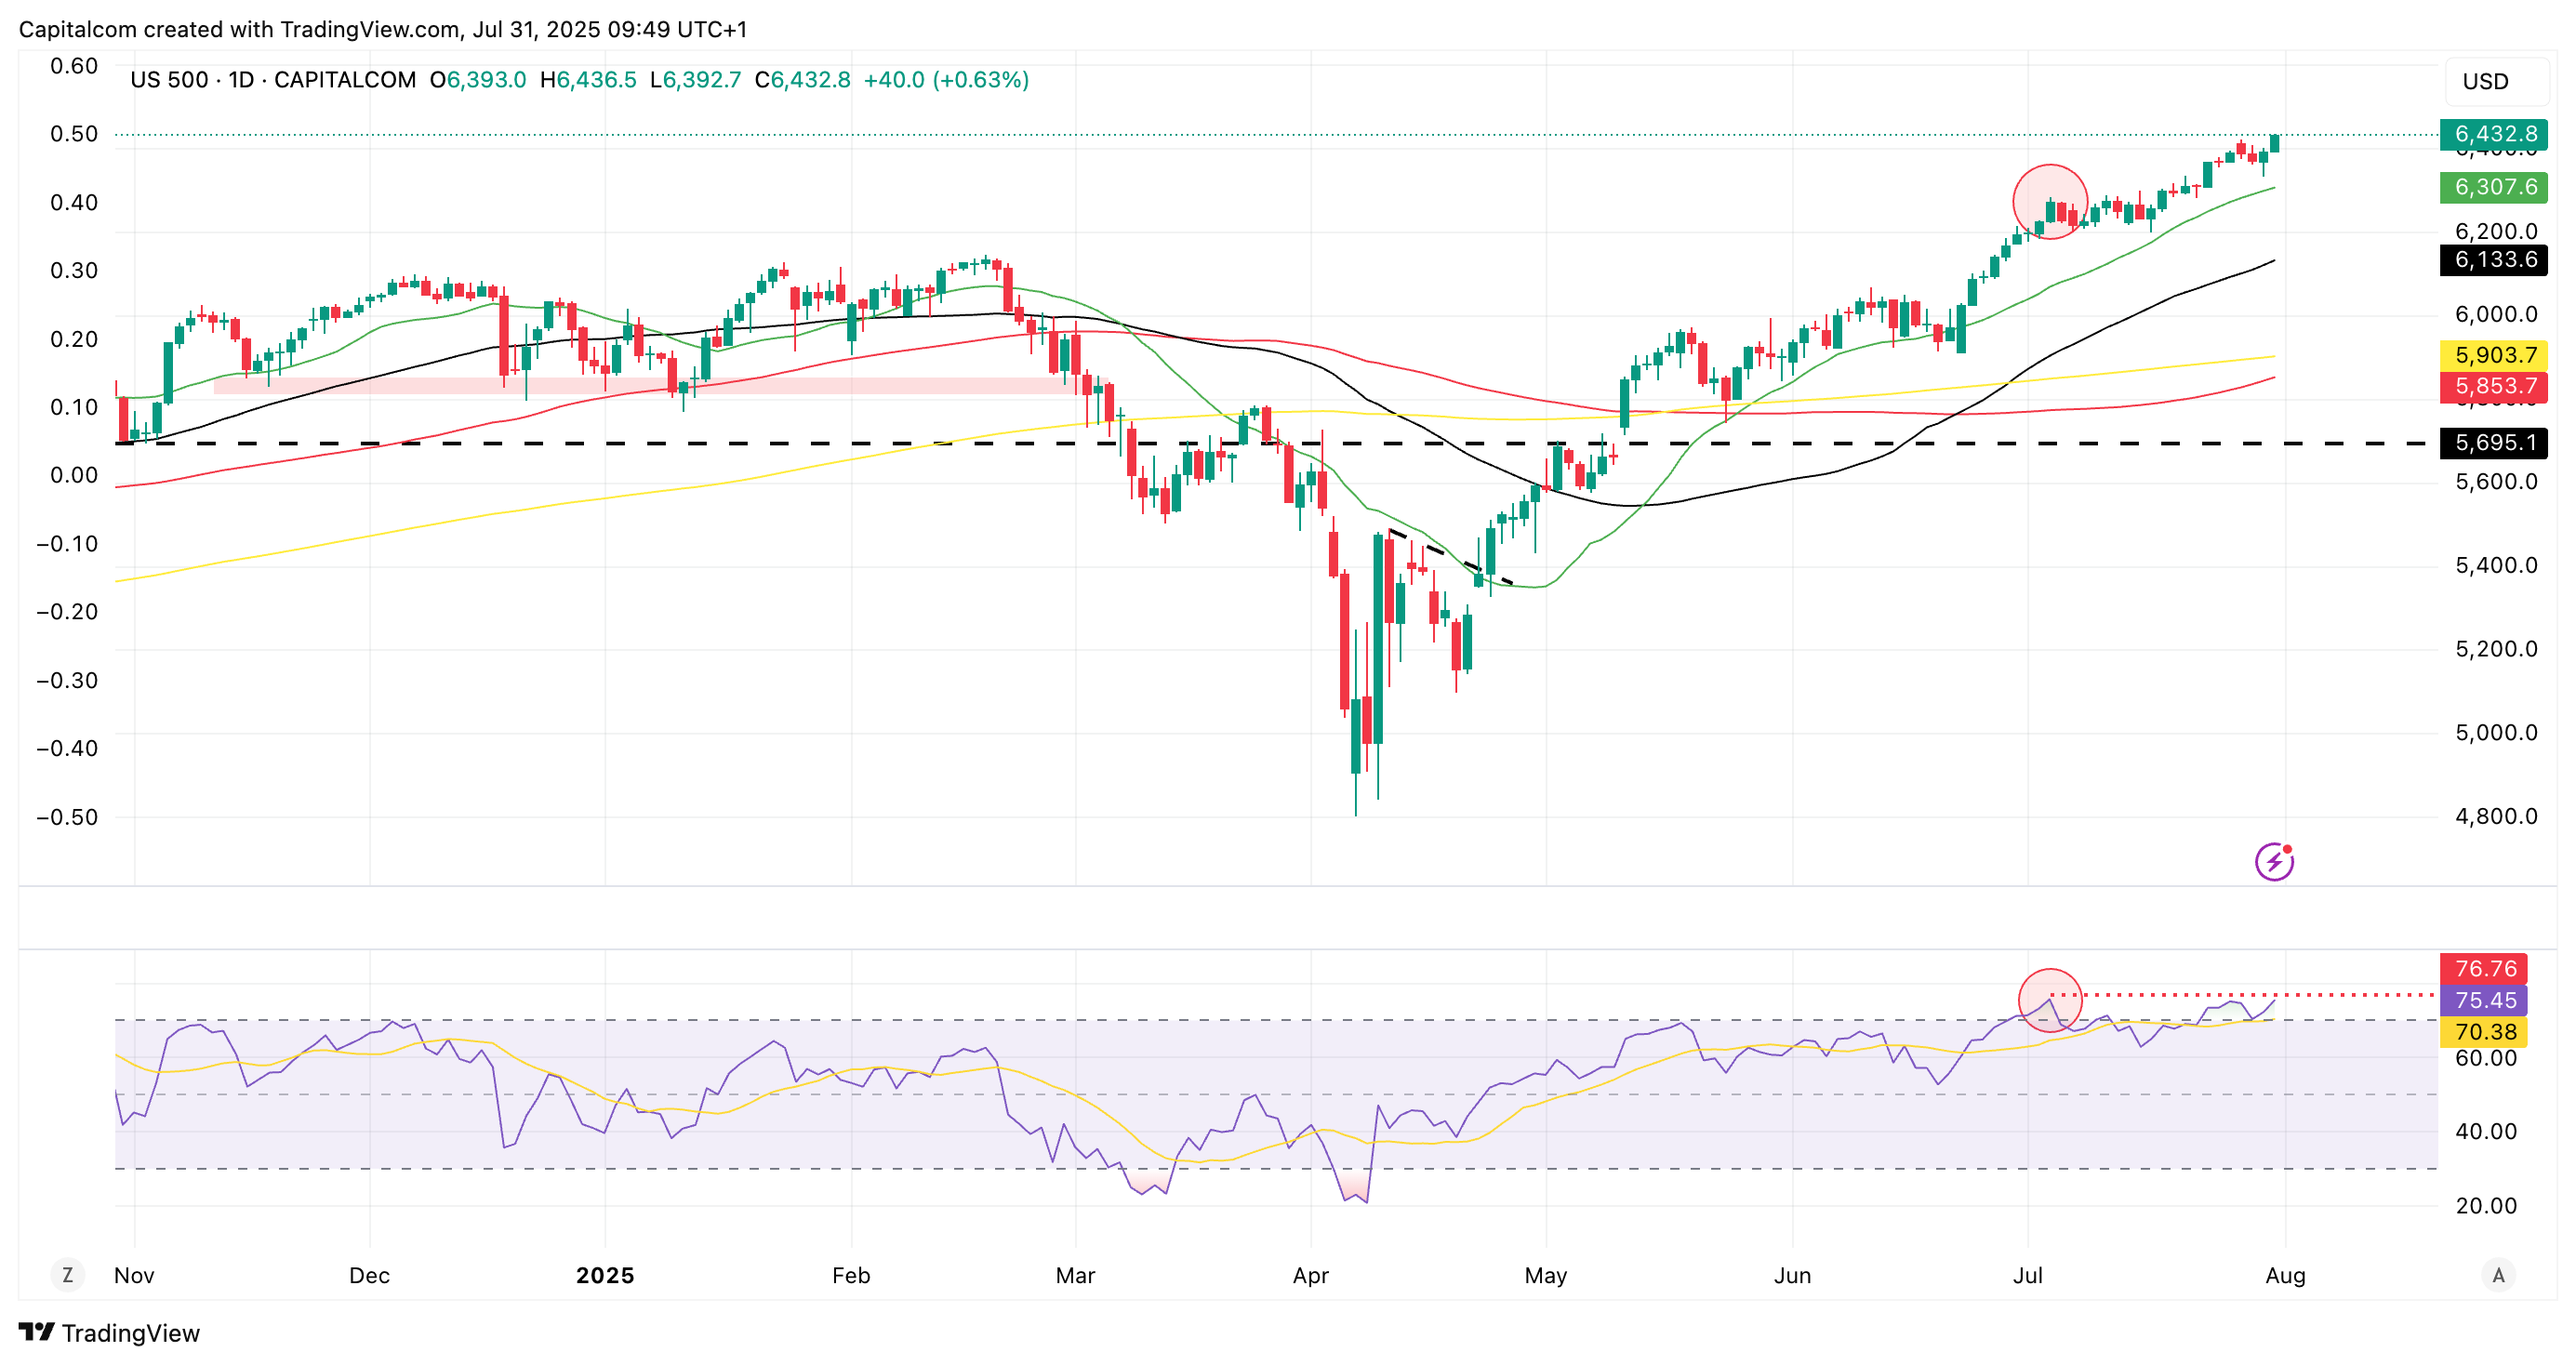
As for markets, the bullish momentum seems to remain strong in US equities, with the S&P 500 and Nasdaq 100 continuously pushing to new highs. The strong GDP data seems to have bolstered sentiment heading into the NFP reading, but S&P 500 traders should watch out for a possible RSI divergence emerging on the daily chart. As the price pushes to new highs, the RSI has failed to mark a new high since the beginning of July. If the index is unable to follow the price and break above 76.75 then buyers may be in for some weakness ahead, with a possible technical correction on the horizon.
S&P 500 daily chart
Past performance is not a reliable indicator of future results.