Trading the S&P 500: Bracing for Non-Farm Payrolls
Another record high yesterday, with gains in the futures market taking it beyond 6,230.
There were a few items to digest yesterday on the fundamental front, starting with weaker economic data out of the US with ADP’s (Automatic Data Processing) non-farm estimate not just a clear miss but showing surprise contraction with a -33K print. That was the opposite of roughly 100K forecasts of growth, and raised worries regarding the labor market that no doubt will keep market participants guessing ahead of today’s (usually) market-moving Non-Farm Payrolls (NFP) out of the BLS (Bureau of Labor Statistics). Forecasts have been revised slightly lower ahead of the event but still expect over 100K of growth, though the unemployment rate is seen rising a notch to 4.3% and at highs unseen in about a year.
And yet, Wall Street finished higher yesterday, buoyed by the trade deal announcement between the US and Vietnam that’ll see tariffs applied by the former on the latter of 20% (and 40% for transshipping), far lower than the original amount seen on ‘Liberation Day’ of about 50%. That helped retailers who manufacture a chunk of their goods in the manufacturing powerhouse, propelling S&P 500 components like Nike to a higher finish. Bank stocks fared well as the Federal Reserve’s (Fed) stress test results prior gave an excuse for them to hike dividends, but as always tech in focus in a session that offered decent gains for semiconductors.
More trade deals are expected, but for now the other item traders will be noting aside from the impacting NFP print is the expected passage of the ‘big beautiful bill’, and its impact on the bond market. The weekly claims, services PMIs, and factory orders are also releasing later today. The pressure is still on the Fed to cut rates, the latest being US President Trump posting that Fed Chairman Powell ought to “resign immediately”. Regardless of whether that’ll happen, rate cut likelihoods (CME’s FedWatch) have risen for July even if still a minority, and almost fully priced in for a 25bp interest rate reduction in September.
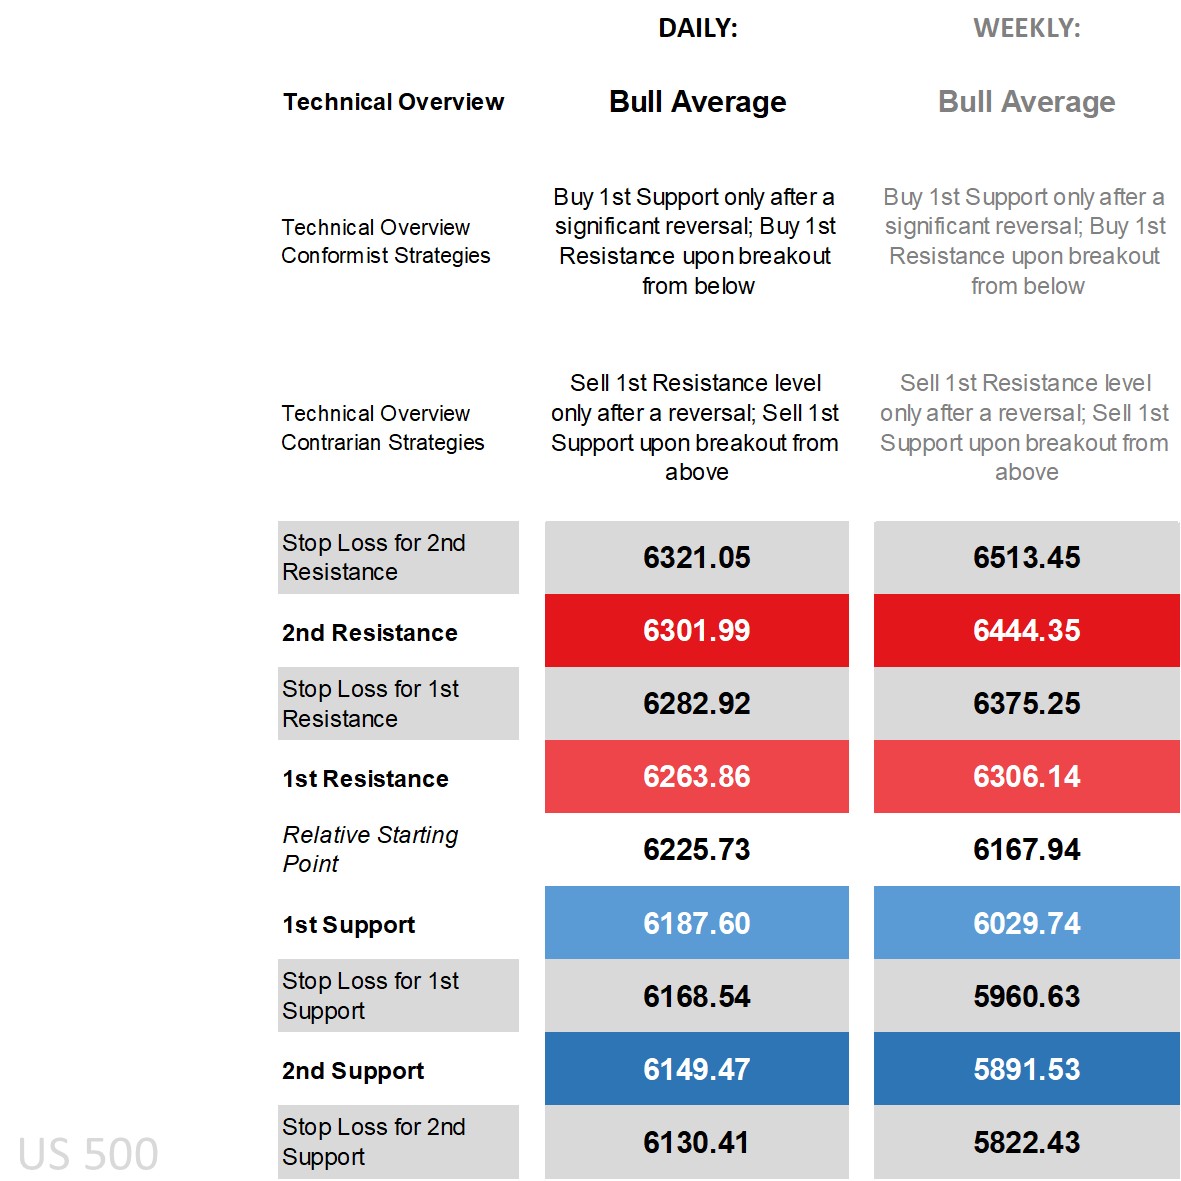
S&P 500’s technical overview, strategies and levels
Record highs and in such a manner means we’re looking at a technical overview that’ll be positive to say the least. Price is above all its main daily moving averages, walking the upper end of the Bollinger Band, a positive DMI (Directional Movement Index) with a sizable margin for the DI+ over the DI-, an RSI (Relative Strength Index) in overbought territory, and an ADX (Average Directional Movement Index) by one calculation in trending territory and not far off it by another. The technical overview is ‘bull average’ on the daily time frame, and was ‘bull average’ on the weekly time frame for quite some time. Aligned on the overviews then, and so too on strategies where buy strategies are in the conformist camp for those seeing ongoing gains, and sell strategies for contrarians who (for whatever reason) aren’t as optimistic in the current climate.
Those going for buy strategies off the 1st Support level (whether on the daily or weekly time frame) ideally doing so only after a significant reversal to avoid getting stopped out should we get a channel move, and those looking to short into price increases only after a reversal if fundamental events cause an uptick in volatility.
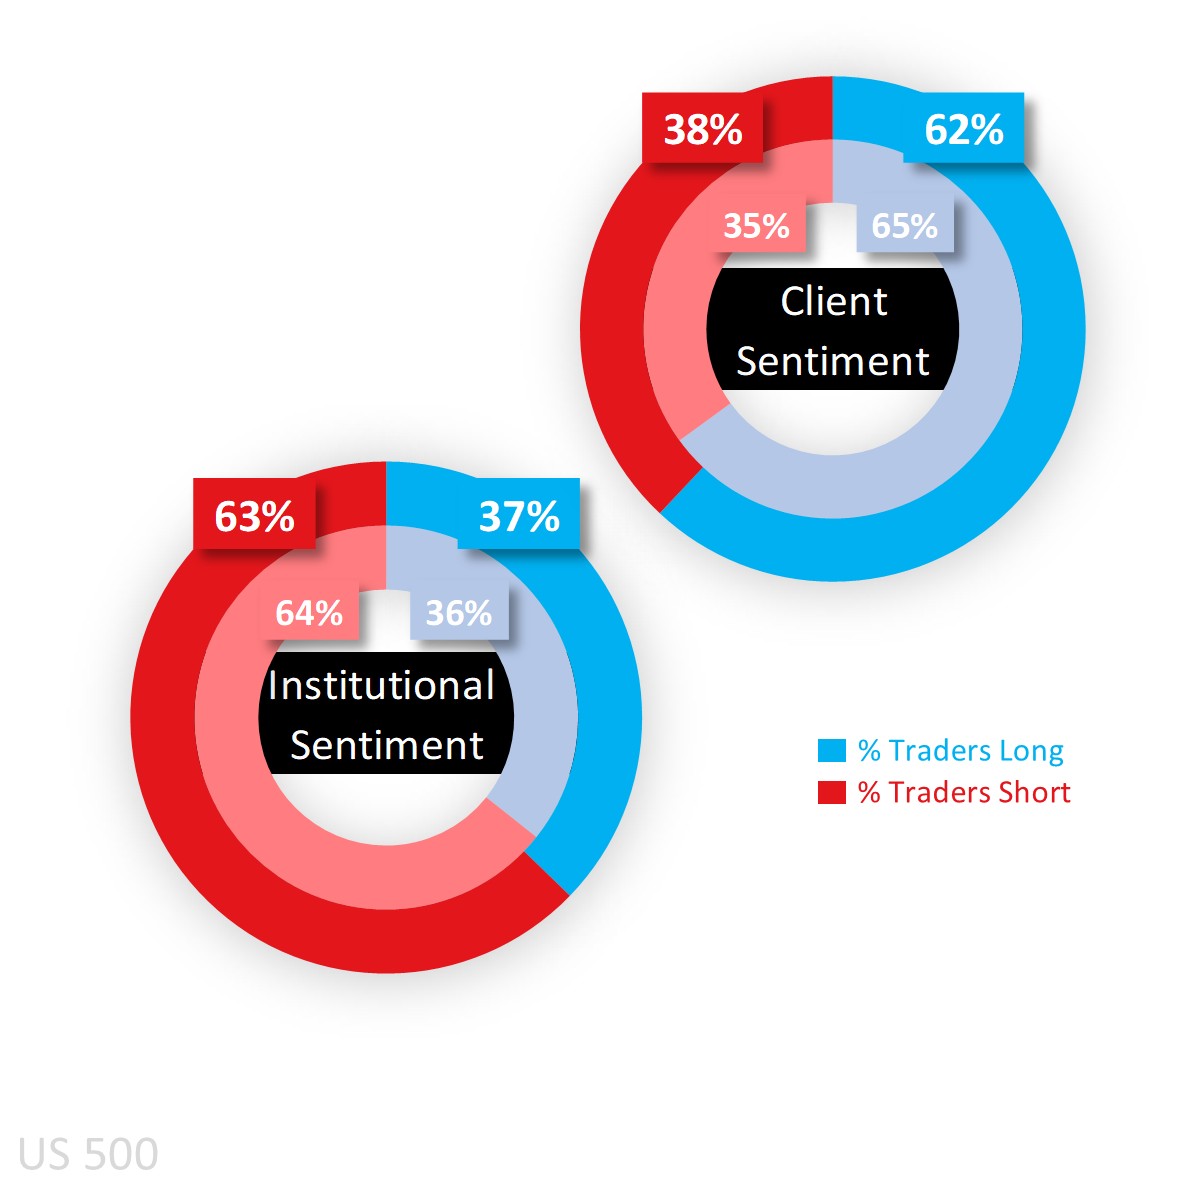
Capital.com’s client sentiment for S&P 500 and that of CoT speculators
As for sentiment going into the NFP event, traders on our end are majority buy but have been trimming that bias with price gains likely enticed by the record highs. They have fallen out of heavy buy territory given they were long 65% yesterday, and looking at them mapped below (yellow-dotted line) and it has generally been a story of slowly unwinding that long sentiment.
As for CoT speculators, they are net sell 63% trimming it a couple notches from the week before due to a larger reduction in shorts (-41,365 lots) compared to the drop in long positions (-9,216), though keep in mind those that are using it as a tool to hedge against a portfolio that largely resembles the S&P 500 in terms of sector exposure and in turn less representative of what we’re seeing in markets where positioning is more speculative such as the Dow (where they are net buy 64%).
Client sentiment mapped on the daily chart
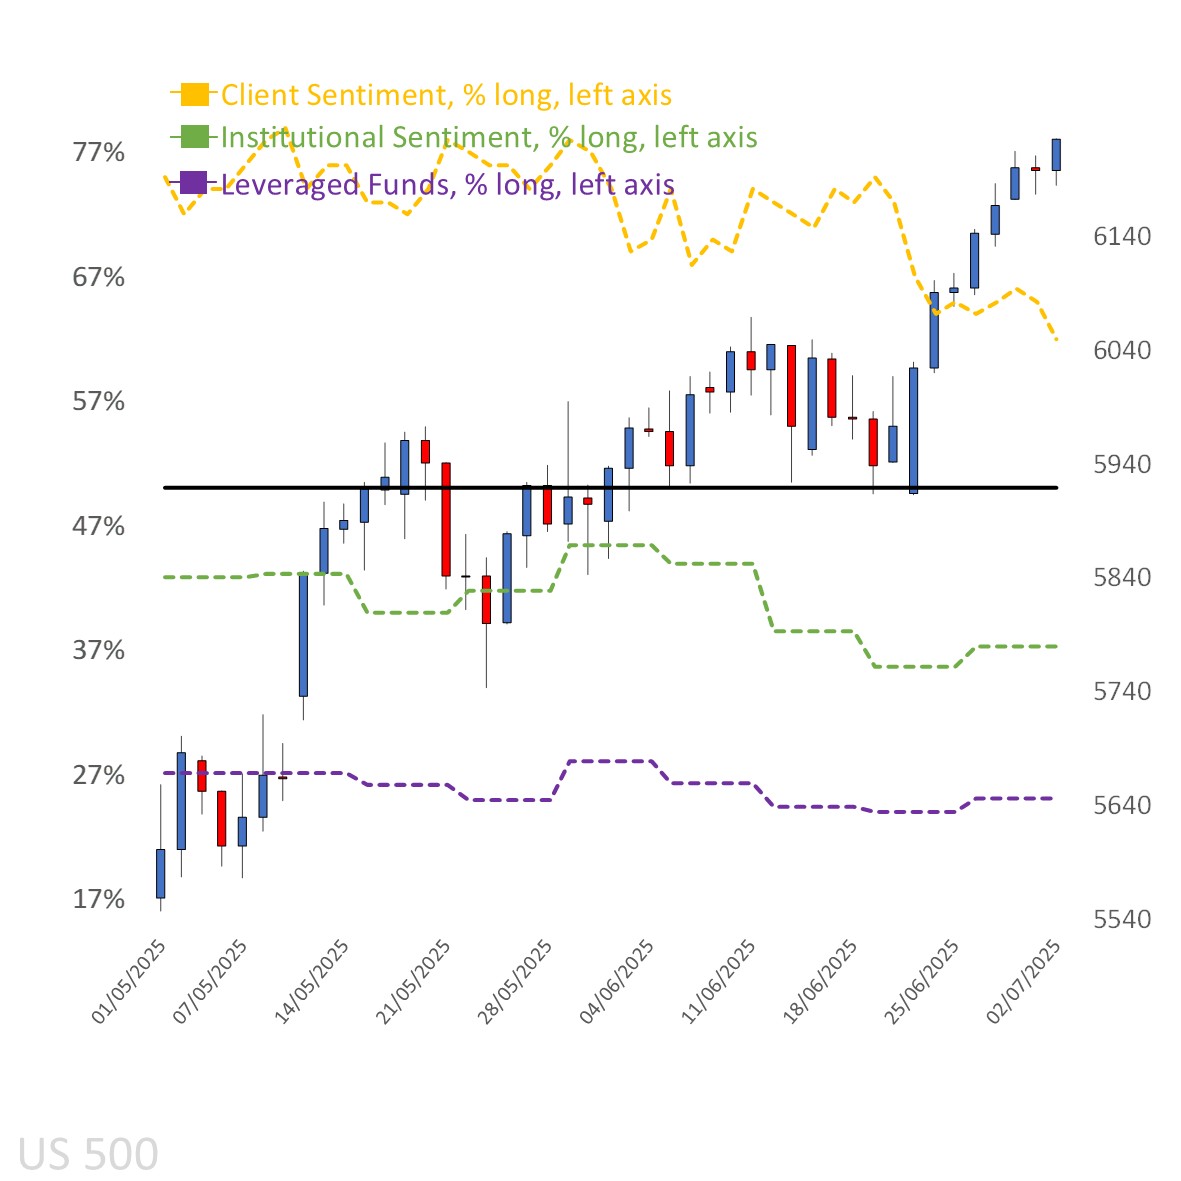
Source: Capital.com
Period: 05.01.2025 – 02.07.2025
Past performance is not an indicator of future results.
S&P 500’s chart on Capital.com platform with key technical indicators
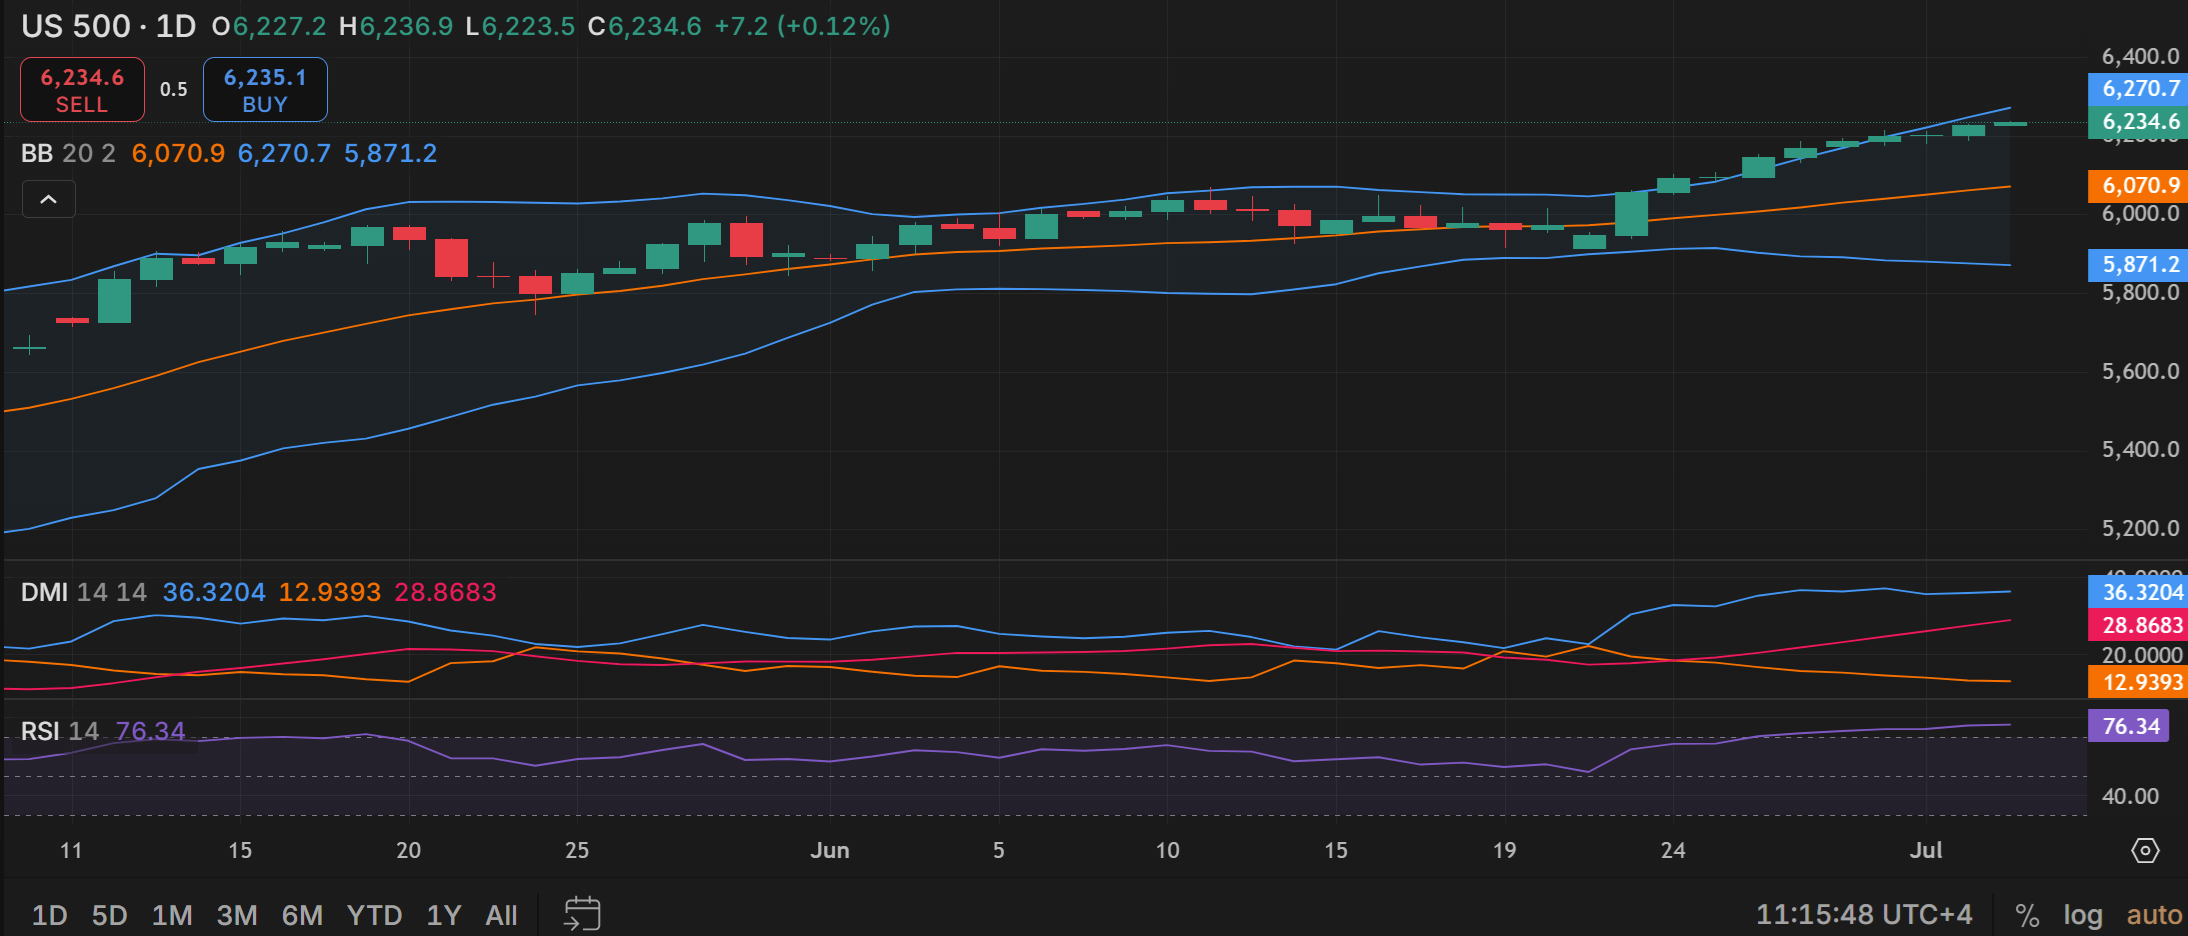
Source: Capital.com
Period: May 2025 – July 2025
Past performance is not an indicator of future results.
RISK DISCLAIMER
CFDs are complex instruments and come with a high risk of losing money rapidly due to leverage. 82.12% of retail investor accounts lose money. You should consider whether you understand how CFDs work and whether you can afford to take the high risk of losing your money.
Past performance is no guarantee of future results. Professional clients can lose more than they deposit. All trading involves risk.
RESEARCH DISCLAIMER
THE PRESENT MATERIAL MUST BE REGARDED AS MARKETING COMMUNICATION AND SHOULD NOT BE INTERPRETED AS INVESTMENT RESEARCH OR INVESTMENT ADVICE.
The content of this communication has been prepared solely for information purposes and should be considered as such. This communication does not constitute research in accordance with the legal requirements designed to promote investment research independence. While the information in this communication, or on which this communication is based, has been obtained from sources that Capital.com believes to be reliable and accurate, it has not undergone independent verification. No representation or warranty, whether expressed or implied, is made as to the accuracy or completeness of any information obtained from third parties.
The information provided as at the date of this communication is subject to change without prior notice. It does not take into consideration the investors’ individual circumstances or objectives and should not be construed as specific advice on the suitability of any investment decision. Investors should consider this report as merely one factor in making any investment decisions. To the extent permitted by law, neither Capital.com nor any of its employees or affiliates accept any liability whatsoever for any direct or consequential loss arising, directly or indirectly, from any use of this communication or its contents. Any person acting on the information does so entirely at their own risk. Any information that may be provided in this communication relating to past performance is not a reliable indicator of future results or performance.
Capital Com Online Investments Ltd is a limited liability company with company number 209236B. Capital Com Online Investments Ltd is a Company registered in the Commonwealth of The Bahamas and authorised by the Securities Commission of The Bahamas with license number SIA-F245. The Company’s registered office is at #3 Bayside Executive Park, Blake Road and West Bay Street, P. O. Box CB 13012, Nassau, The Bahamas.