
DOT price prediction: 2.1bn supply cap, issuance cut
Polkadot (DOT) is designed to connect independent blockchains. In March 2026, it introduced a 2.1 billion DOT supply cap and reduced annual token issuance by 53.6%. Explore third-party DOT price targets and technical analysis. Past performance is not a reliable indicator of future results.
Polkadot (DOT/USD) last traded around $0.9539 at 10:33am UTC on 2 November 2026, within an intraday range of $0.9415–$0.9602. Past performance is not a reliable indicator of future results.
Recent Polkadot developments include the introduction of a 2.1 billion DOT hard supply cap and a 53.6% reduction in annual token issuance introduced in March 2026, alongside the launch of the dotUSD stablecoin on 8 October (CryptoTicker, 17 October 2026).
Cryptocurrency markets also saw volatility following the $6.3bn Binance hack (Reuters, 29 October 2026). Reuters reports that Binance customers had withdrawn just under $5 billion from the exchange after it had resumed withdrawals in early November (Reuters, 2 November 2026).
Third-party Polkadot outlook: dotUSD launch, supply changes
As of 2 November 2026, third-party DOT price predictions include model-based estimates and conditional scenarios. These forecasts do not represent a broker consensus or investment recommendations.
Polkadot price prediction 2026
- CoinLore estimates a year-end 2026 base-case price of $0.77 (CoinLore, 2 November 2026).
- CoinCodex projects a $0.90 average DOT by the end of 2026, with a range of $0.82–$0.96 (CoinCodex, 2 November 2026).
- CoinDataFlow forecasts a 2026 price range of $0.64–$1.02. Projections cannot account for sudden or extreme price movements (CoinDataFlow, 1 November 2026).
- Crypto News puts DOT's December 2026 base-case estimate at $1.12, within a range of $0.96 and $1.35 (crypto.news, 2 November 2026).
Polkadot price prediction 2027
- CoinLore projects a base-case price of $0.88, with bearish and bullish scenarios of $0.53 and $3.30 respectively, drawing on historical price data, technical indicators and volatility analysis (CoinLore, 2 November 2026).
- CoinDataFlow forecasts a 2027 trading range of $0.62–$1.68, with an average price of $1.15, using a model based on Bitcoin's four-year cycle and historical market data (CoinDataFlow, 1 November 2026).
- CoinCodex estimates a $0.72 average 2027 DOT price for 2027, from $0.53 to $0.89 (CoinCodex, 2 November 2026).
Polkadot price prediction 2030
- CoinLore models a base-case price of $1.75, with bearish and bullish scenarios of $1.05 and $9.09 respectively, drawing on long-term scenario analysis using seven years of historical price data (CoinLore, 2 November 2026).
- CoinDataFlow projects a range of $1.88–$6.97, with an average price of $4.42, using cycle-based modelling (CoinDataFlow, 1 November 2026).
- CoinCodex forecasts a 2030 average DOT price of around $0.46, in a range of approximately $0.38–$0.53 (CoinCodex, 1 November 2026).
Predictions and third-party forecasts are inherently uncertain, as they cannot fully account for unexpected market developments. Past performance is not a reliable indicator of future results.
Polkadot technical analysis
The DOT/USD price trades at $0.9539 as of 10:33am UTC on 2 November 2026, below its main simple moving averages (SMAs). According to TradingView data, the 20-, 50-, 100- and 200-day SMAs stand at approximately $1.0588, $1.1209, $0.9926 and $1.0294 respectively, while the 200-day exponential moving average (EMA) sits at $1.1662.
The 20-day SMA remains below the 50-day SMA, while momentum indicators suggest limited upward momentum. The 14-day relative strength index (RSI) reads 37.34, within the lower part of the neutral range, while the average directional index (ADX) at 21.90 suggests no firmly established trend. The moving average convergence divergence (MACD) stands at −0.0532 and stochastic %K at 24.9549, both consistent with weaker momentum.
On the upside, the 100-day SMA at $0.9926 provides a nearby technical reference, followed by the classic pivot point at $1.0364. Beyond these levels, R1 stands at $1.2053 and R2 at $1.4656.
On the downside, S1 at $0.7761 provides a lower support reference. A move above the central pivot could bring R1 into focus, while further declines could draw attention towards S1. These levels are reference points rather than reliable predictors of future price movements (TradingView, 2 November 2026).
This is technical analysis for informational purposes only and does not constitute financial advice or a recommendation to buy or sell any instrument.
Polkadot price history (2024–2026)
DOT/USD’s CFD price was above $10 in early December 2024 before declining through the following months. By late January 2025, the price had eased towards $6.30, falling further to around $3.50 by early April. DOT moved above $5 in May, but renewed selling brought it back towards $3.40 by June. The token then traded above $4 at several points between July and September.
The decline resumed in October 2025, when DOT fell below $3, before ending the year near $1.80. The downward trend also continued into 2026, with the token dropping below $1 in June and testing lows around $0.75 in August. DOT rose above $1.25 in October, but the price subsequently retreated, closing the month near $0.95.
As of 10:33am UTC on 2 November 2026, DOT traded at $0.9539, within an intraday range of $0.9415–$0.9602, well below its late-2024 levels.

Past performance is not a reliable indicator of future results. Prices are indicative and may differ from live market prices.
Capital.com analyst view: Polkadot
Network developments, including the 2.1 billion DOT supply cap and reduced annual issuance, have altered Polkadot’s token supply schedule, although their effect on price will depend on demand and wider market conditions (Polkadot, accessed 2 November 2026).
The launch of dotUSD on 8 October 2026 could increase network activity and transaction volumes as adoption develops. However, regulatory requirements and the extent of adoption may limit its effect on demand for DOT (TokenPost, 8 October 2026).
Greater network adoption or improving market conditions could support demand for DOT, while slower adoption, weaker market sentiment or further security concerns could weigh on its price.
Capital.com’s client sentiment for Polkadot CFDs
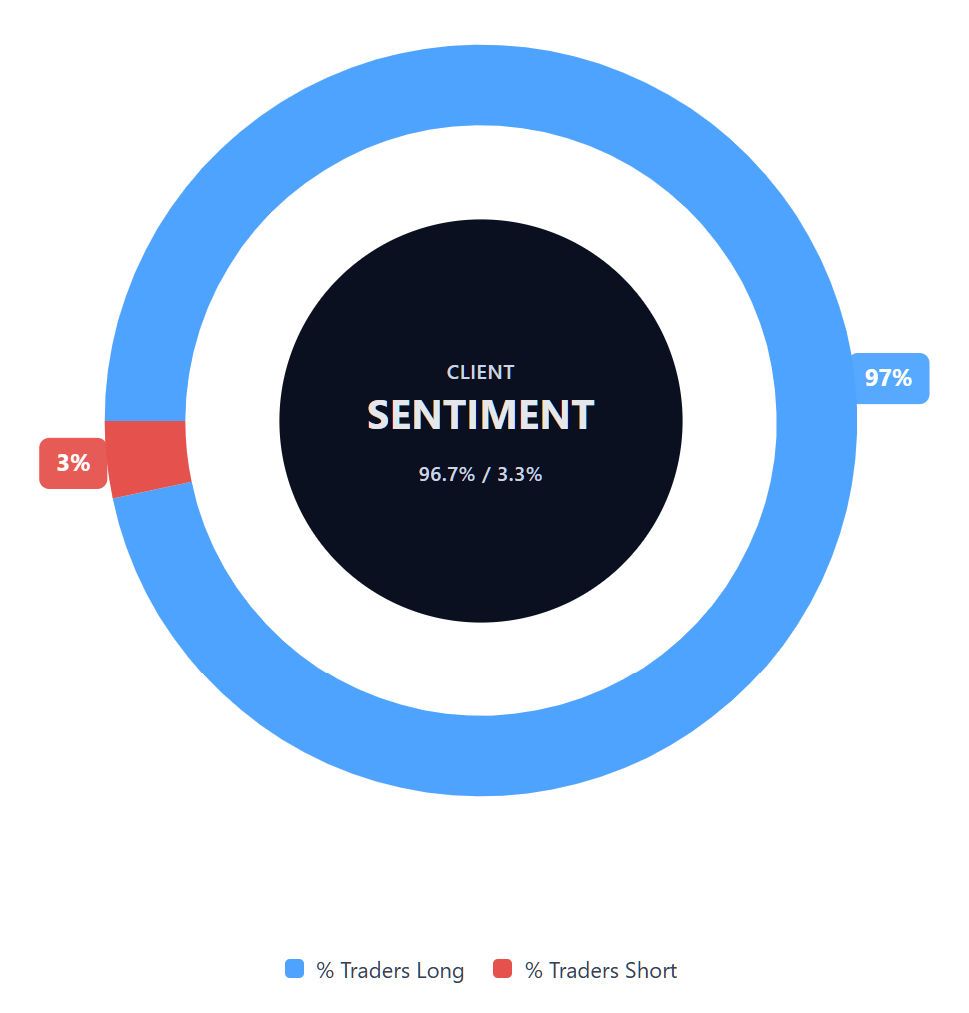
As of 2 November 2026, buyers account for 96.7% of open Polkadot CFDs on Capital.com, compared with 3.3% sellers, a difference of 93.4 percentage points. This snapshot can change and does not indicate future price direction.
Summary – Polkadot (2026)
- Polkadot CFDs traded at $0.9539, within an intraday range of $0.9415–$0.9602, as of 10:33am UTC on 2 November 2026.
- On TradingView, technical indicators place DOT below its main moving averages, with the RSI at 37.34 indicating relatively weak momentum without reaching oversold territory.
- Recent developments include the launch of dotUSD and changes to Polkadot's token issuance, against a backdrop of wider cryptocurrency market volatility following the Binance security breach.
- Potential price influences include network adoption, reduced token issuance and wider cryptocurrency sentiment, alongside regulatory, competitive and execution risks.
Past performance is not a reliable indicator of future results.