US100 forecast: Third-party targets
The US Tech 100 reflects the performance of some of the largest non-financial companies listed on the Nasdaq and is often used as a reference point for movements in the US technology sector.
The US Tech 100 (US100) is trading around 25,541.5 as of 2:26pm UTC on 9 January 2026, remaining within an intraday range between 25,446.1 and 25,666.6 on Capital.com’s platform. Past performance is not a reliable indicator of future results.
The index is trading against a backdrop of recent softness in large US technology names, after the Nasdaq 100 cash benchmark fell about 0.6% to around 25,507.1 in the previous session (Trading Economics, 9 January 2026), while the Dow Jones Industrial Average gained roughly 0.6% and the S&P 500 was broadly flat (Trading Economics, 9 January 2026).
US Tech 100 forecast 2026–2030: Third-party targets
As of 9 January 2026, third-party US100 predictions show a wide dispersion of potential outcomes, reflecting differing assumptions around artificial intelligence spending, US economic growth, interest rates and earnings concentration risks. The following summaries highlight a selection of recent third-party forecasts and scenario-based projections.
Bank of America (US equity and macro outlook)
Bank of America, in its 2026 US economy and markets outlook, flags modest upside for major US equity indices, linking expected Nasdaq 100 gains to an S&P 500 target near 7,100 under a base-case scenario of solid but slowing earnings growth and moderating inflation. The bank notes that AI-related capital expenditure and selective technology earnings resilience could support US growth-oriented sectors, even as reduced buybacks, tighter liquidity conditions and policy uncertainty limit the scope for multiple expansion (Bank of America Private Bank, 1 December 2025).
J.P. Morgan (global research outlook)
J.P. Morgan Global Research’s 2026 market outlook expects style and sector positioning to broadly resemble 2025, highlighting a 'winner-takes-all' dynamic and record concentration in large technology and growth stocks. The report points to AI-linked earnings growth of around 13–15% as a factor underpinning US equity performance, with indices such as the Nasdaq 100 benefiting from tech-heavy exposure, while also flagging crowding risk and sensitivity to changes in yields and risk sentiment (J.P. Morgan, 9 December 2025).
Vanguard (multi-asset economic and market projections)
Vanguard’s research paper, AI exuberance: Economic upside, stock market downside, outlines a scenario in which US technology stocks may maintain momentum into 2026, alongside an AI-driven investment cycle and an expected pickup in US real GDP growth to around 2.25%. The study emphasises that sustained investment in AI and digital infrastructure could support technology-sector earnings, while higher valuations and potential volatility keep equity return distributions wide and sensitive to macroeconomic and policy developments (Vanguard, 10 December 2025).
UBS (US tech and growth sectors)
UBS, in a CIO commentary on US growth and thematic sectors, identifies the US technology sector as a potential driver of market performance into 2026, citing underlying fundamentals behind the AI theme and improving monetisation of AI-related products and services. At the same time, the bank highlights opportunities across health care, utilities and financials, positioning US technology exposure as part of a broader allocation framework rather than a standalone directional view (UBS, 4 December 2025).
Predictions and third-party forecasts are inherently uncertain, as they cannot fully account for unexpected market developments. Past performance is not a reliable indicator of future results.
US100 price: Technical overview
The US100 Index is trading near 25,541.5 as of 2:26pm UTC on 9 January 2026, holding above a rising moving-average cluster, with the 20-, 50-, 100- and 200-day SMAs around 25,393 / 25,347 / 24,831 / 23,063, preserving the 20-over-50 alignment. The 14-day RSI, near 52.9, sits in neutral territory, while a subdued ADX around 12.4 suggests a weak underlying trend rather than a strong directional phase.
On the topside, the nearest classic resistance is the R1 pivot near 25,840, with R2 around 26,432 coming back into view only on a sustained daily close above the first barrier. On pullbacks, the classic pivot at 25,244 is the initial support reference, with the 100-day SMA near 24,831 forming a deeper moving-average shelf and S1 around 24,653 marking the next downside level should the pivot area fail (TradingView, 9 January 2026).
This is technical analysis for informational purposes only and does not constitute financial advice or a recommendation to buy or sell any instrument.
US Tech 100 history (2024–2026)
Over the past two years, the US Tech 100 index has climbed from around 16,800 in mid-January 2024 to about 25,546 on 9 January 2026, reflecting a technology-led recovery following a softer period in early 2024. The index pulled back toward the 17,000–18,000 area in the first half of 2024, before advancing more steadily through late 2024 and 2025. This move included consolidation phases around 20,000 in mid-2024 and 23,000–24,000 in mid-2025, before breaking above 25,000 toward year-end.
By early January 2026, US100 was trading near the upper end of its recent range, having held above 25,000 since late December 2025 and briefly setting short-term highs above 25,650 during the first week of the new year.
US100’s is around
Past performance is not a reliable indicator of future results. Share prices are indicative and may differ from live market prices.
US Tech 100 (US100): Capital.com analyst view
The US Tech 100 has spent much of the past two years trending higher overall, with periodic pullbacks as sentiment shifted around interest rates, earnings and the broader macroeconomic backdrop. The index tracks 100 of the largest non-financial companies listed on the Nasdaq, meaning its price can be particularly sensitive to changes in technology leadership, innovation-related themes and risk appetite, while also remaining exposed to sharp reversals when growth expectations or liquidity conditions change.
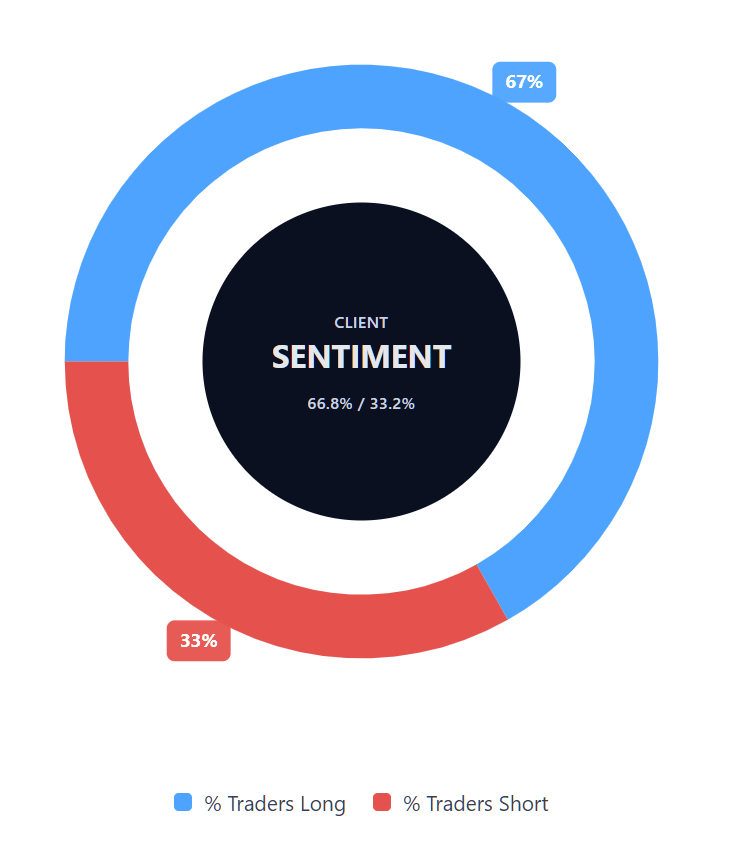
Capital.com’s client sentiment for US Tech 100 CFDs
As of 9 January 2026, Capital.com client positioning in US Tech 100 CFDs shows 66.8% buyers versus 33.2% sellers, leaving sentiment in majority-buy territory without reaching extreme levels and placing buyers ahead by around 33.6 percentage points. This snapshot reflects open positions on Capital.com and can change over time.
Summary – US Tech 100 2026
- US Tech 100 (US100) spent 2025 in an overall uptrend, rising from around 21,000 in early January to the mid-25,000s by year-end on Capital.com’s feed.
- Price action included several consolidation phases, notably within the 23,000–24,000 range during mid-2025, before achieving repeated closes above 25,000 in December.
- Intraday volatility remained a feature, with frequent 300–500-point moves around macroeconomic events and large-cap technology earnings, without a sustained break in the broader rising structure.
- Technical conditions at year-end showed the 20-, 50-, 100- and 200-day SMAs all trending higher beneath price, indicating an established upward bias on this timeframe.
Past performance is not a reliable indicator of future results.
FAQ
Could US Tech 100 go up or down?
Yes, the US Tech 100 can move both higher and lower, sometimes over short periods. Its price is influenced by company earnings, shifts in investor sentiment, changes in interest rates and broader economic conditions. Given its sector concentration, moves in a handful of large technology stocks can have an outsized impact on index performance. As with all markets, past price behaviour does not reliably indicate how the index will perform in the future.
Should I invest in the US Tech 100?
Deciding whether to invest in the US Tech 100 involves assessing your personal financial situation, risk tolerance and understanding of market volatility. The index represents exposure to a group of equities rather than a single stock and may not suit all investors, particularly during periods of heightened uncertainty. This content is provided for informational purposes only and should not be interpreted as investment advice or a suggestion to take any specific action.
How do I trade US Tech 100 CFDs on Capital.com?
Trading US Tech 100 CFDs on Capital.com lets you speculate on movements without owning the underlying asset and to take long or short positions. However, contracts for difference (CFDs) are traded on margin, and leverage amplifies both profits and losses. You should ensure you understand how CFD trading works, assess your risk tolerance, and recognise that losses can occur quickly.