Trading Tesla after its earnings miss
Q2 earnings and revenue miss sees shares drop in extended trading as CEO Musk warns of the possibility of a “few rough quarters”
Markets might be in a positive mood thanks to trade deals and hopes of further progress on that front as we approach the August 1 US tariff deadline, but for shares of Tesla it was anything but happy in extended trading suffering a drop of about 4.6% and reaching the $317 handle. That’s because it released its quarterly figures, and they most certainly disappointed. Earnings per share was 40 cents below expectations of 43 cents. Revenue was also a miss at $22.5bn vs $22.7bn forecast with automotive revenue suffering double-digit percentage declines as sales fell again, and revenue from the sale of auto regulatory credits cut in half compared to a year earlier.
The catalyst for lower car sales? Potential political association that doesn’t look to die down any time soon, and where sales could continue to struggle given the expiration of federal EV (electric vehicle) tax credits. CEO Elon Musk said they “probably could have a few rough quarters”, costs are still a worry due to tariffs according to the company’s finance chief and even worse, they “may not be able to guarantee delivery orders placed in the later part of August and beyond”.
That’s the bad news, but as with any growth stock one has to look ahead and see what’s in the pipeline, and for Tesla there’s (1) “first builds of a more affordable model” this month with “volume production planned for the second half of 2025”, (2) the robotaxi front where they intend to “improve and expand the service” aiming to reach about half the US population by the end of the year should regulators approve, and (3) improvement in Supercharging gross profit up 17% y/y.
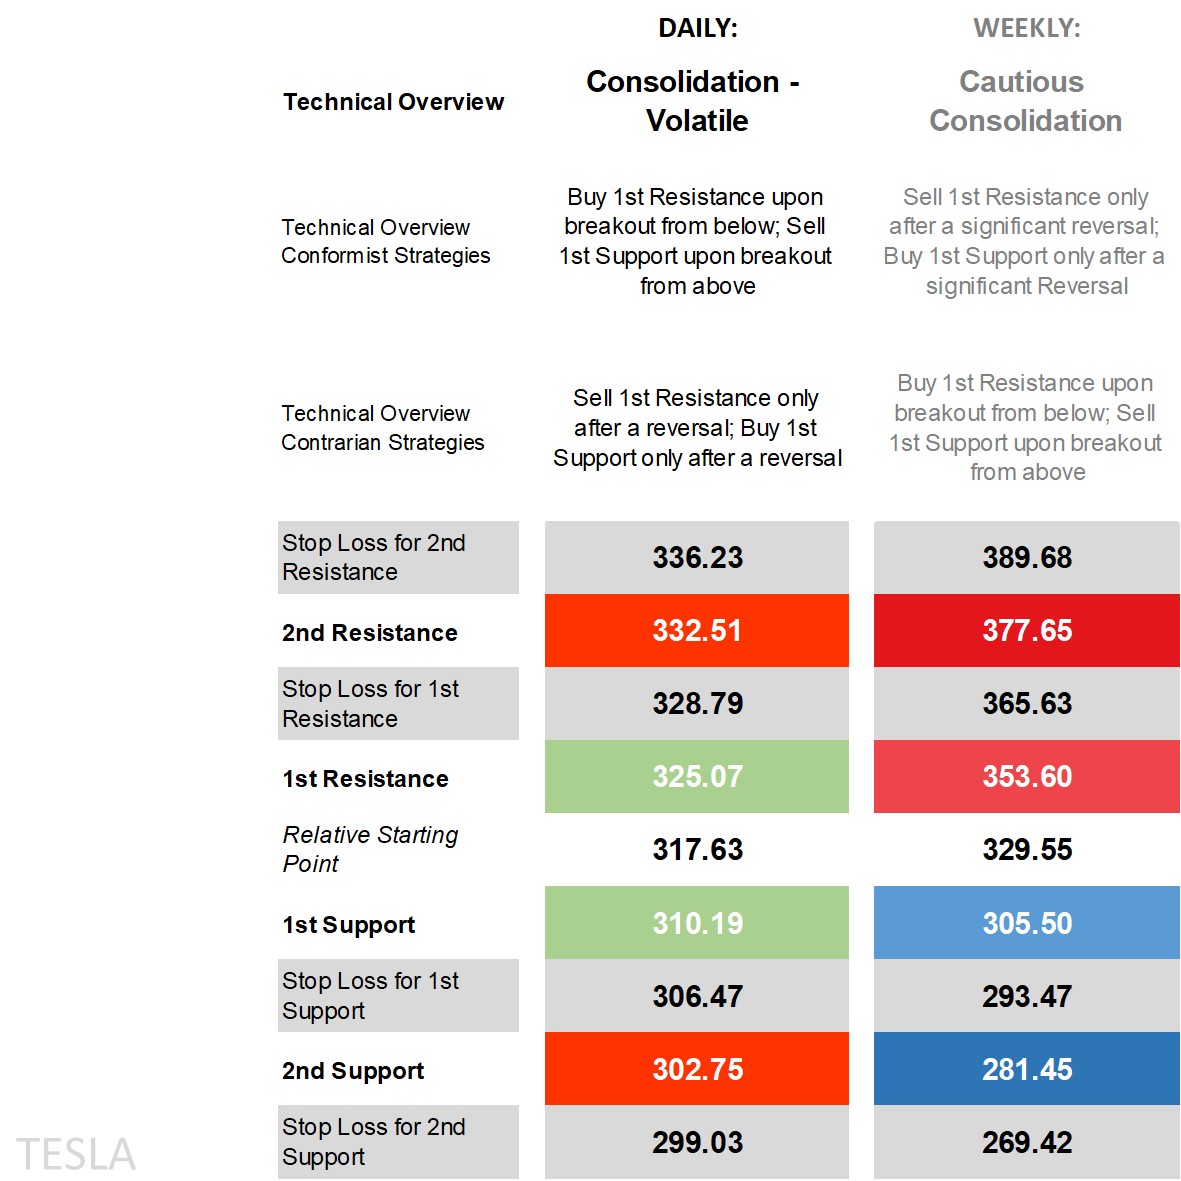
Tesla’s technical overview, strategies and levels
Big moves the likes of which we saw yesterday gave breakout strategies the edge, but that’s due to earnings without it would have potentially meant calmer waters. Looking at the daily time frame and price isn’t above nor beneath all of its main moving averages in both the short and long-term, back at the middle of somewhat narrowing Bollinger Bands, an RSI (Relative Strength Index) near 50 also in the middle, and an ADX (Average Directional Movement Index) falling further into non-trending territory. There’s been a negative DMI (Directional Movement Index) cross following the pullback in price but -DI to +DI proximity has made it difficult to rely on it as a signal.
Its key technical indicators neutral usually means a consolidatory technical overview similar to the weekly time frame where its ‘cautious consolidation’, and while that could remain the case as a technical triangle is seen forming, it usually results in an eventual breakout. The overview doesn’t require much to shift from what was ‘consolidation – volatile’ on the daily time frame where breakout strategies are in the conformist camp, but they’ve had to be patient sometimes requiring an additional session or two in order to get follow-through past intraday levels.
Those expecting the levels to behave can opt to go for contrarian strategies, be it selling after a reversal off the 1st Resistance waiting for price to breach the level first and only going opposite if it comes back down, or after a reversal off the 1st Support letting it break beneath $310.19 and only buying should it manage to recover back to that level else letting the market slide without getting stuck with a long position on a further pullback in price.
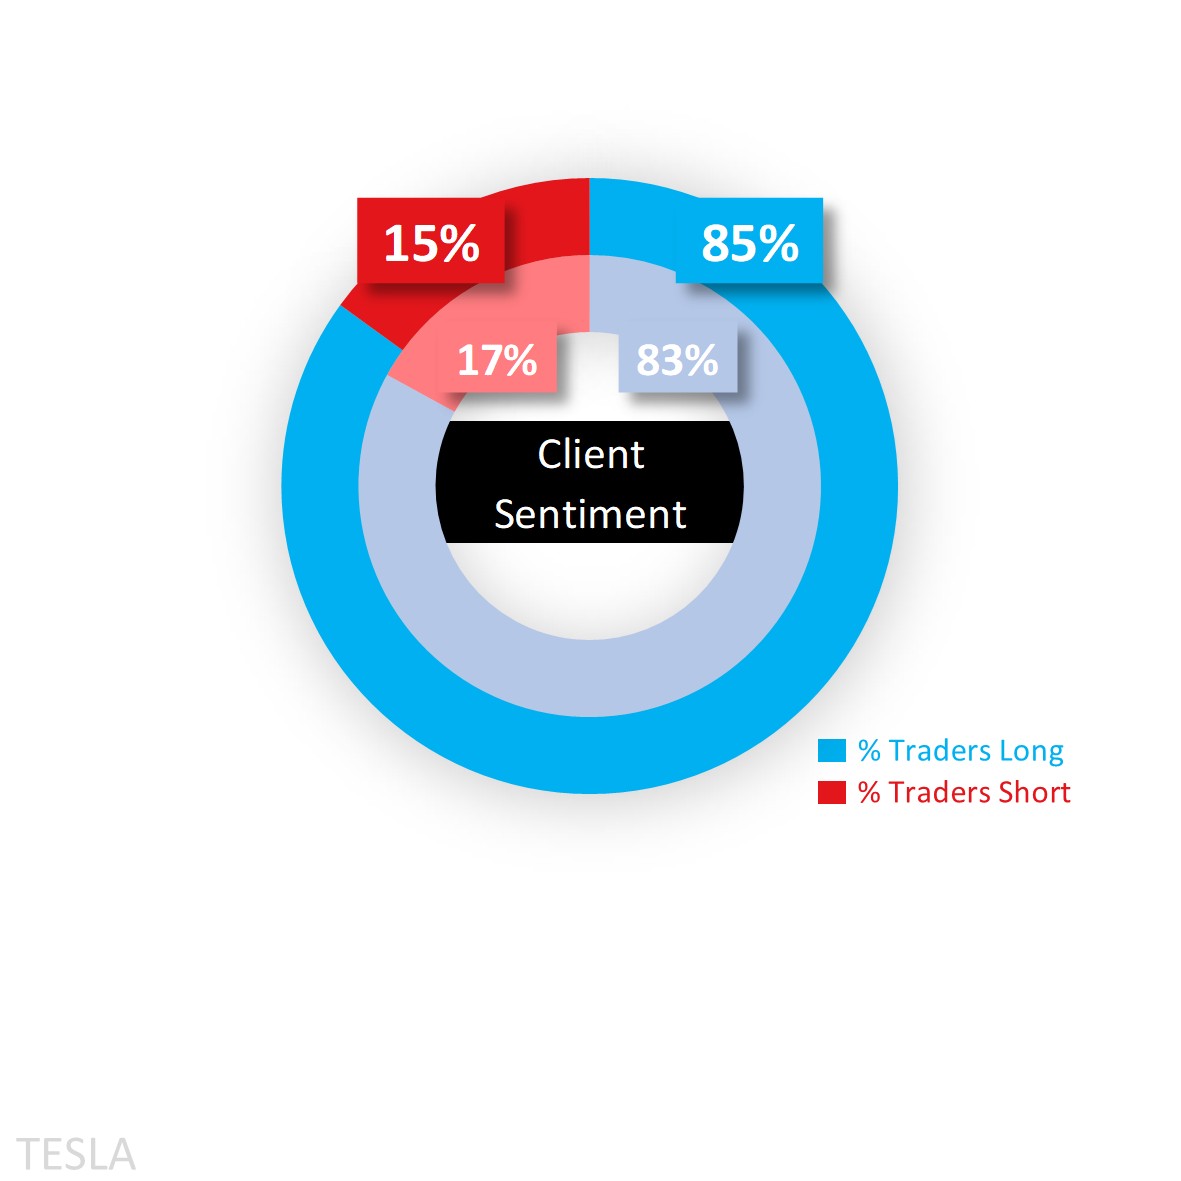
Capital.com’s client sentiment for Tesla
As for sentiment, it’s been a consistent story of majority buy bias in Tesla and lately pushing further into extreme buy territory at 85% as of this morning from 83% before the earnings release. While seemingly high, it’s still relatively lower than the remaining magnificent seven where the buy bias is 90% and above.
Client sentiment mapped on the daily chart
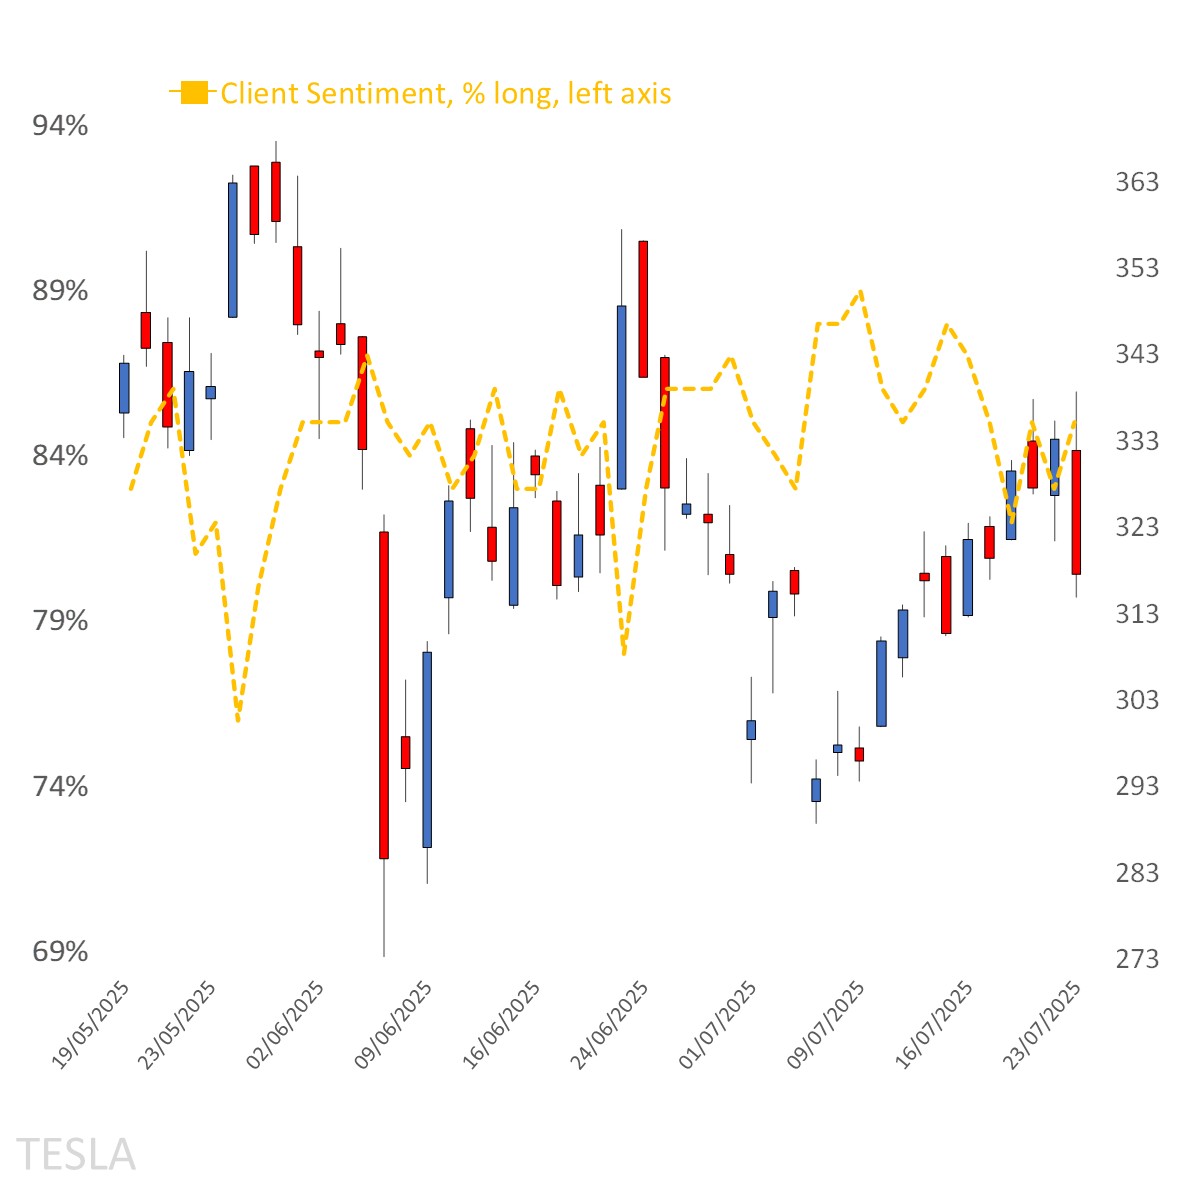
Source: Capital.com
Period: May 2025 – July 2025
Past performance is not an indicator of future results.
Tesla’s chart on Capital.com platform with key technical indicators
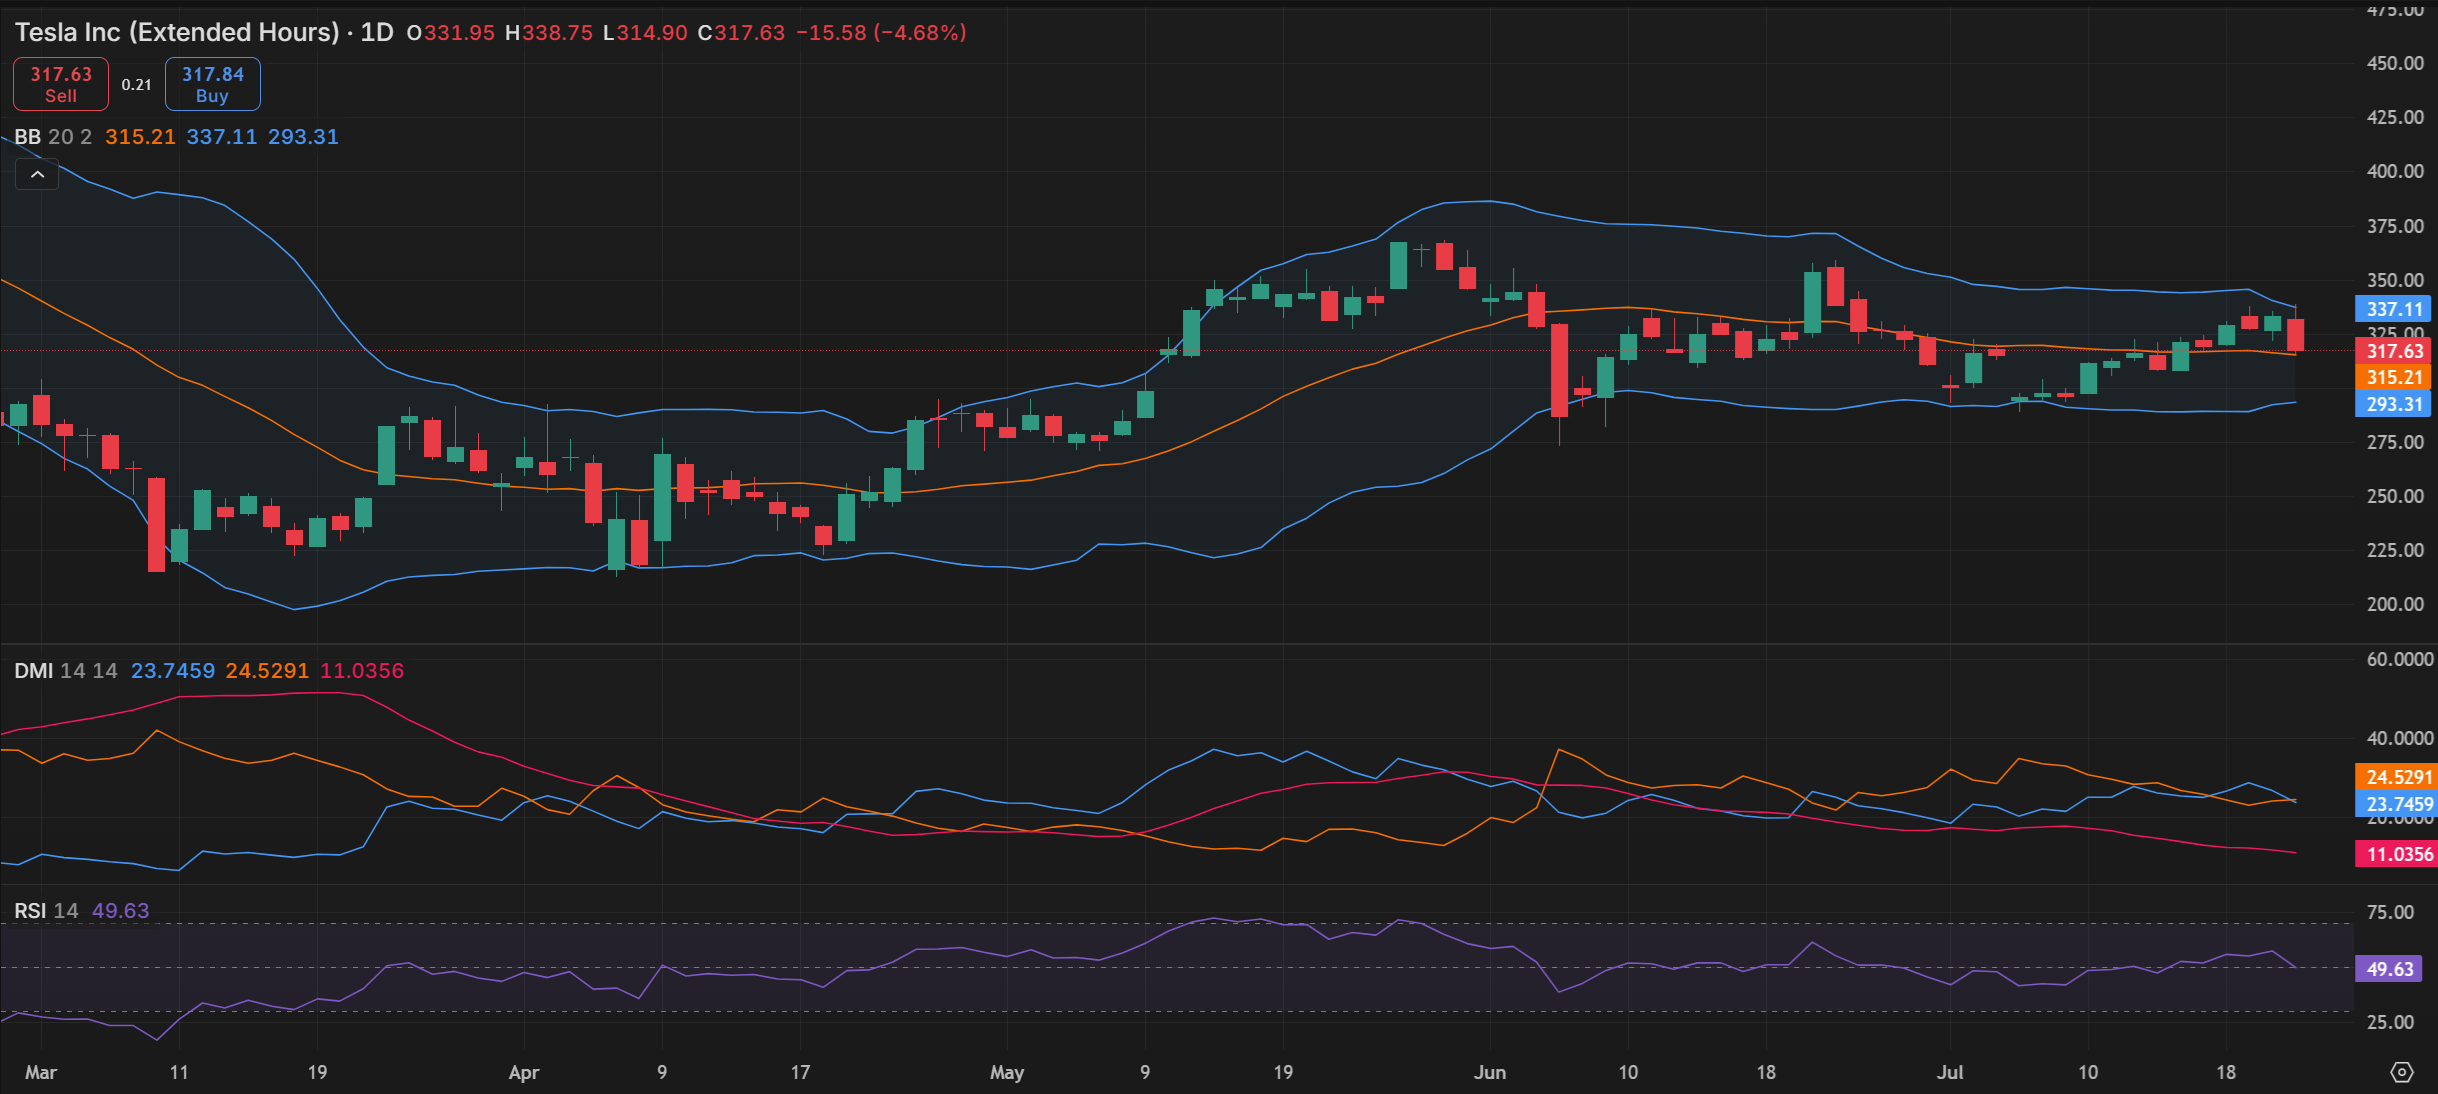
Source: Capital.com
Period: March 2025 – July 2025
Past performance is not an indicator of future results.
Try demo Go to market page
RISK DISCLAIMER
CFDs are complex instruments and come with a high risk of losing money rapidly due to leverage. 82.12% of retail investor accounts lose money. You should consider whether you understand how CFDs work and whether you can afford to take the high risk of losing your money.
Past performance is no guarantee of future results. Professional clients can lose more than they deposit. All trading involves risk.
RESEARCH DISCLAIMER
THE PRESENT MATERIAL MUST BE REGARDED AS MARKETING COMMUNICATION AND SHOULD NOT BE INTERPRETED AS INVESTMENT RESEARCH OR INVESTMENT ADVICE.
The content of this communication has been prepared solely for information purposes and should be considered as such. This communication does not constitute research in accordance with the legal requirements designed to promote investment research independence. While the information in this communication, or on which this communication is based, has been obtained from sources that Capital.com believes to be reliable and accurate, it has not undergone independent verification. No representation or warranty, whether expressed or implied, is made as to the accuracy or completeness of any information obtained from third parties.
The information provided as at the date of this communication is subject to change without prior notice. It does not take into consideration the investors’ individual circumstances or objectives and should not be construed as specific advice on the suitability of any investment decision. Investors should consider this report as merely one factor in making any investment decisions. To the extent permitted by law, neither Capital.com nor any of its employees or affiliates accept any liability whatsoever for any direct or consequential loss arising, directly or indirectly, from any use of this communication or its contents. Any person acting on the information does so entirely at their own risk. Any information that may be provided in this communication relating to past performance is not a reliable indicator of future results or performance.
Capital Com Online Investments Ltd is a limited liability company with company number 209236B. Capital Com Online Investments Ltd is a Company registered in the Commonwealth of The Bahamas and authorised by the Securities Commission of The Bahamas with license number SIA-F245. The Company’s registered office is at #3 Bayside Executive Park, Blake Road and West Bay Street, P. O. Box CB 13012, Nassau, The Bahamas.