Trading Tesla After its 6% Jump
Risk-on moves following last Friday’s Jackson Hole tilts a few technical indicators in Tesla to green, but it is yet to shift its technical overview in either time frame.
US equity index futures are steady after a strong session on Friday for the S&P 500 (+1.5% to 6,466), a record high for the Dow 30 (+1.9% to 45,631), and far larger percentage gains for the small-cap Russell 2000 (+3.9% to 2,361). This came after Federal Reserve Chairman Powell’s speech at Jackson Hole. In it, he said that “the balance of risks appear to be shifting” when it comes to their dual mandate, and that “the baseline outlook and the shifting balance of risks may warrant adjusting our policy stance” though both he and other FOMC members “will make these decisions, based solely on their assessment of the data and its implications for the economic outlook and the balance of risks. We will never deviate from that approach.”
Treasury yields fell back more notably on the front end of the curve as rate cut likelihoods rose following the event, and yields also dropped in real terms as breakeven inflation rates rose. Other FOMC (Federal Open Market Committee) members were a bit more cautious, with Collins talking about growth slowing but that fundamentals are relatively solid with a “range of possibilities” on the table for the September meeting, Musalem that more data is needed before deciding on a rate cut then, and Hammack worried about the possibility that they could “reinvigorate the inflationary pressures” if they’re accommodative. The pressure was still on for the Fed’s Cook, with US President saying he’ll fire her if she doesn’t resign and would in turn present another opportunity for him to replace a member of the board that sets monetary policy with one in favor of easing.
When it came to stock sector performance, any signs of lower rates are a boon and relief for the consumer discretionary sector, and it jumped 3.2% on Friday and outperformed against the remaining ten sectors. Notable gainers within the sector included heavyweight Tesla with its shares closing over 6% higher, and so too Amazon up over 3%. Over in the communication sector there was another tech heavyweight, Alphabet, up 3% by Friday’s close, its Waymo subsidiary getting its first permit to test its autonomous vehicles in NYC
Week ahead
When it comes to the week ahead, it’ll be a relatively quiet start today in terms of economic data with new home sales and a couple indices out of the Chicago and Dallas Fed branches, otherwise a couple FOMC members speaking to give their take on how they view a September rate cut. It picks up tomorrow with durables and consumer confidence, but it’ll really be about earnings from heaviest Nvidia on Wednesday. Preliminary GDP (Gross Domestic Product) and the weekly claims both release on Thursday, and then it’s down to pricing data with PCE (Personal Consumption Expenditures) price index on Friday to see if the figures will be too hot for comfort for the Federal Reserve and its inflation target.
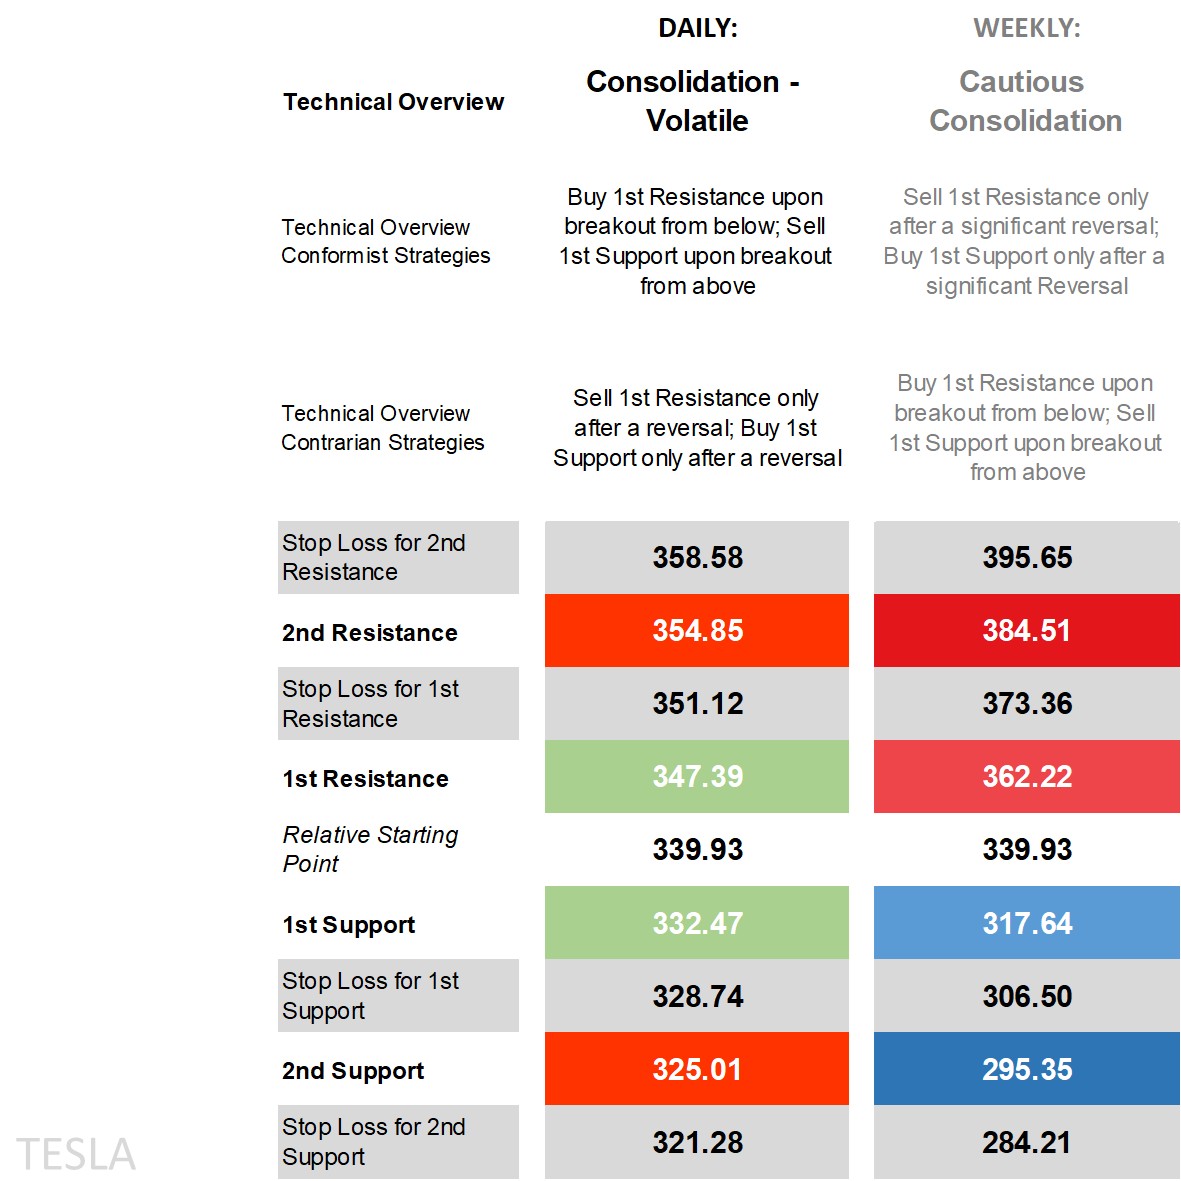
Tesla’s technical overview, strategies and levels
Looking at the key technical indicators on the daily time frame and price is above all its main moving averages and nearing the upper end of the band, on the DMI (Directional Movement Index) front a positive cross occurring for the +DI over the -DI and enough of a margin by one metric to label it as positive, but otherwise its RSI (Relative Strength Index) rising but yet to get close to overbought territory and an ADX (Average Directional Movement Index) still in non-trending territory. A jump that is preceded by mostly oscillatory movement makes it easy to shift shorter-term technicals green, but the overview here remains ‘consolidation – volatile’ where breakout strategies are in the conformist camp for those that see follow-through beyond the 1st levels (be it the 1st Resistance or 1st Support) even if it doesn’t occur intraday rather intraday, and reversal strategies for contrarians who see prices stabilizing at or near these levels and more so if within the same session.
As for the weekly time frame where the levels are larger and can usually contain an uptick in intraday volatility (similar to what occurred last week), the overview is a somewhat opposite ‘cautious consolidation’ with most key technical indicators neutral. Knowing this stock however, and any calm is usually the calm before a storm, and in turn means added caution for conformist strategists going opposite a move at the weekly 1st levels only after a significant reversal waiting for the levels to get breached/broken and only if returns to consider initiating. Contrarians on the weekly time frame who see an eventual breakout have got breakout strategies to work with, but noting intraweek follow-through as to whether it can reach the weekly 2nd levels.
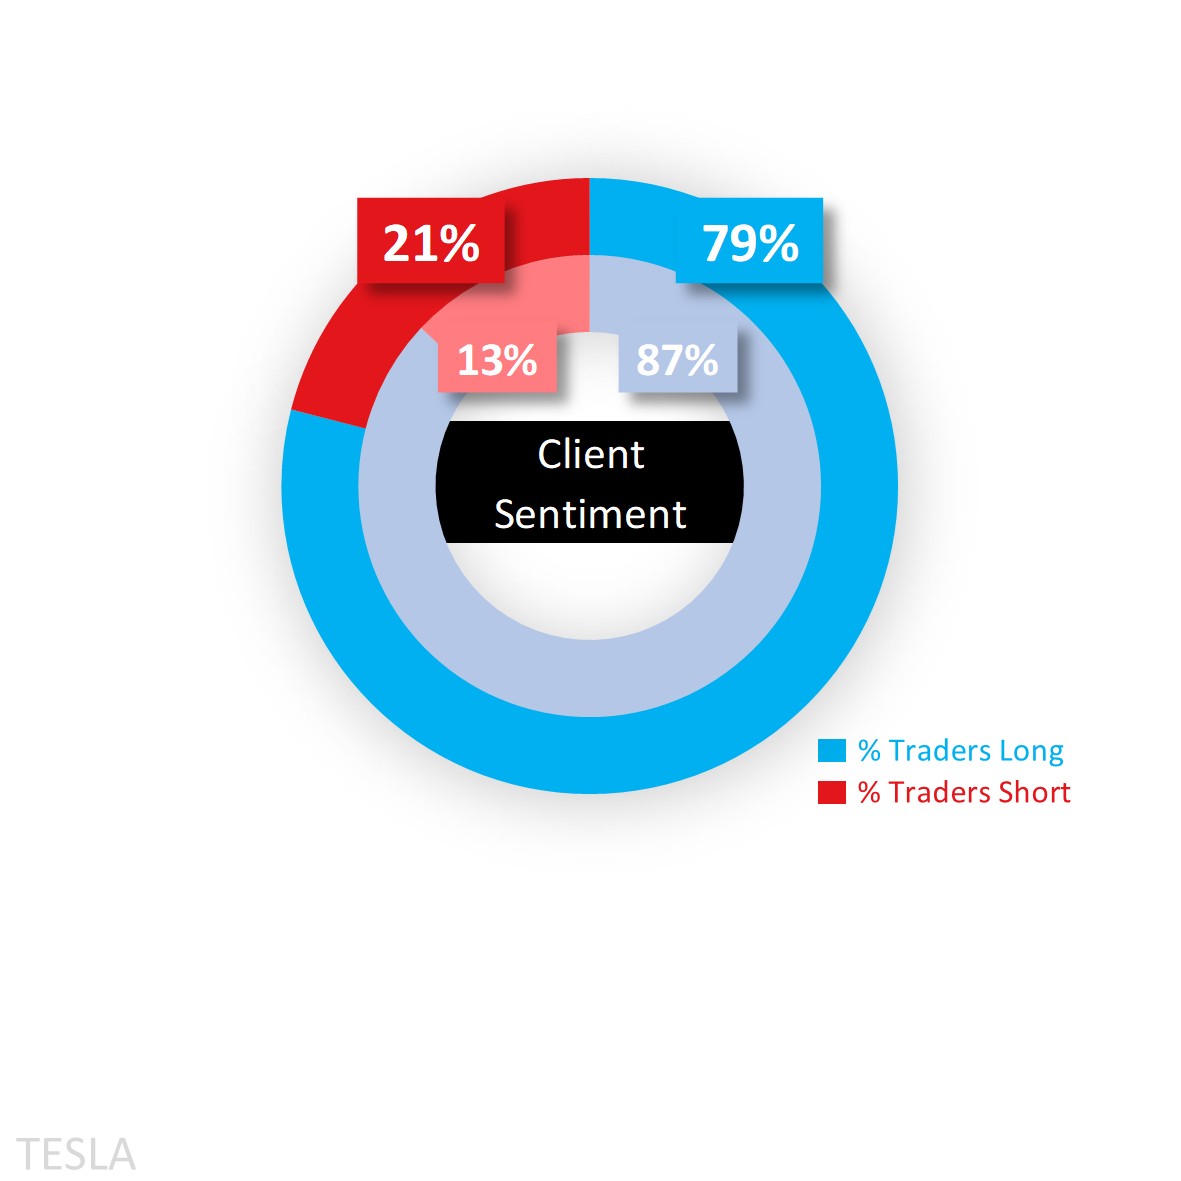
Capital.com’s client sentiment for Tesla
As for sentiment, it has been a story of majority long bias among Capital.com’s traders for months on end, usually oscillating within extreme buy territory as they await upside price gains that’ll entice longs into closing out and shorts into initiating. Last Friday’s move was one of those days that caused a big change in sentiment from 87% on Friday morning to 79% at the start of this week. In all, it’s still in extreme buy territory requiring more upside movement for long sentiment to fall.
Client sentiment mapped on the daily chart
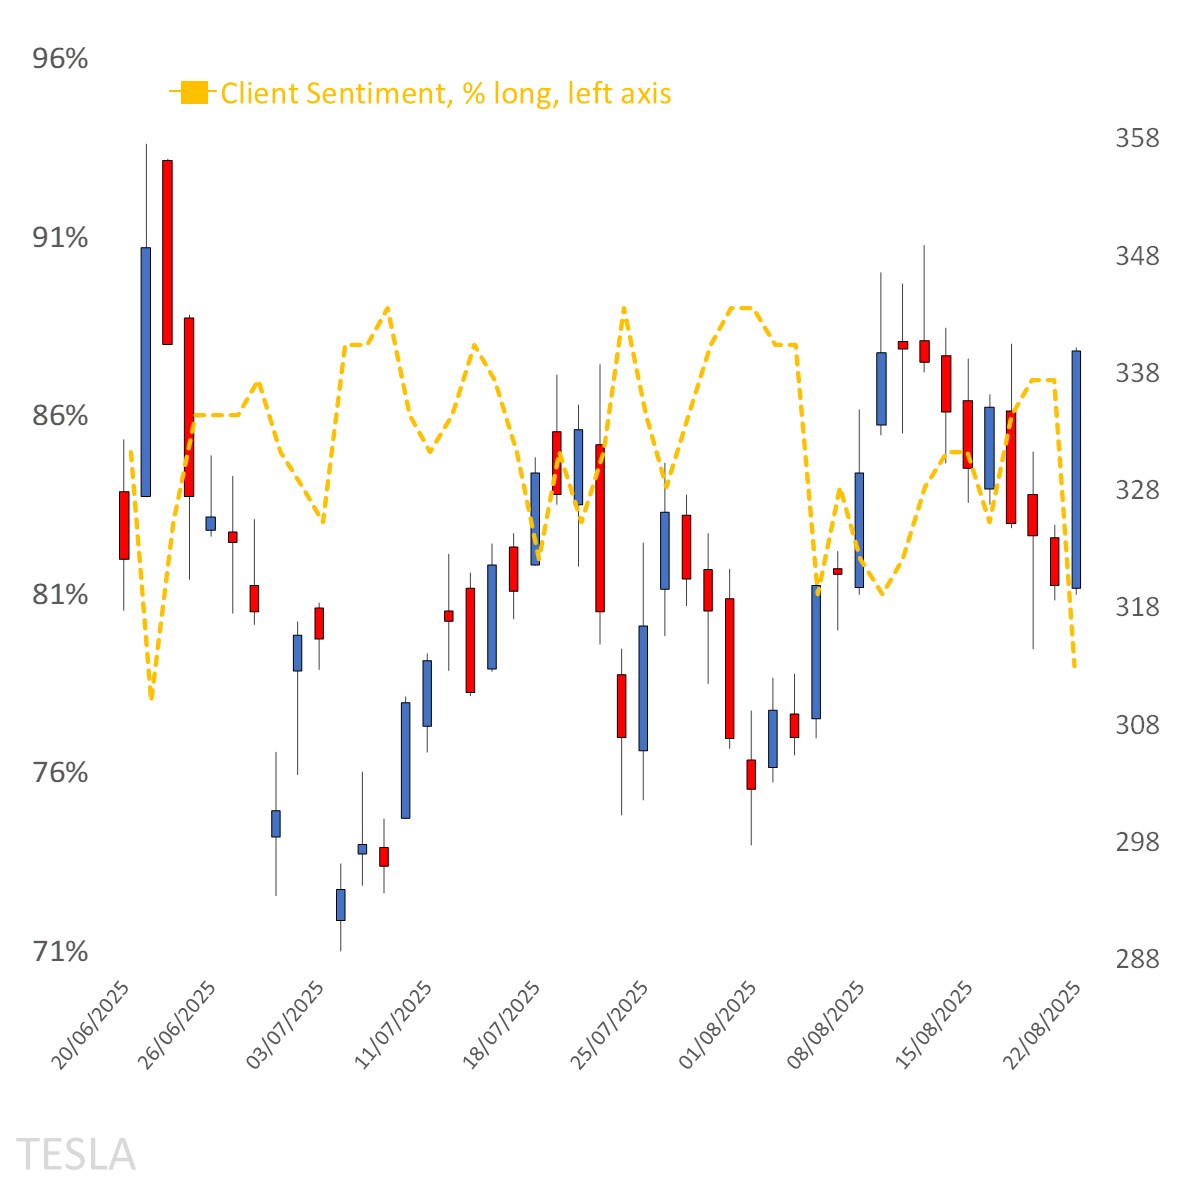
Source: Capital.com
Period: JUNE 2025 – AUGUST 2025
Past performance is not an indicator of future results.
Tesla’s chart on Capital.com platform with key technical indicators
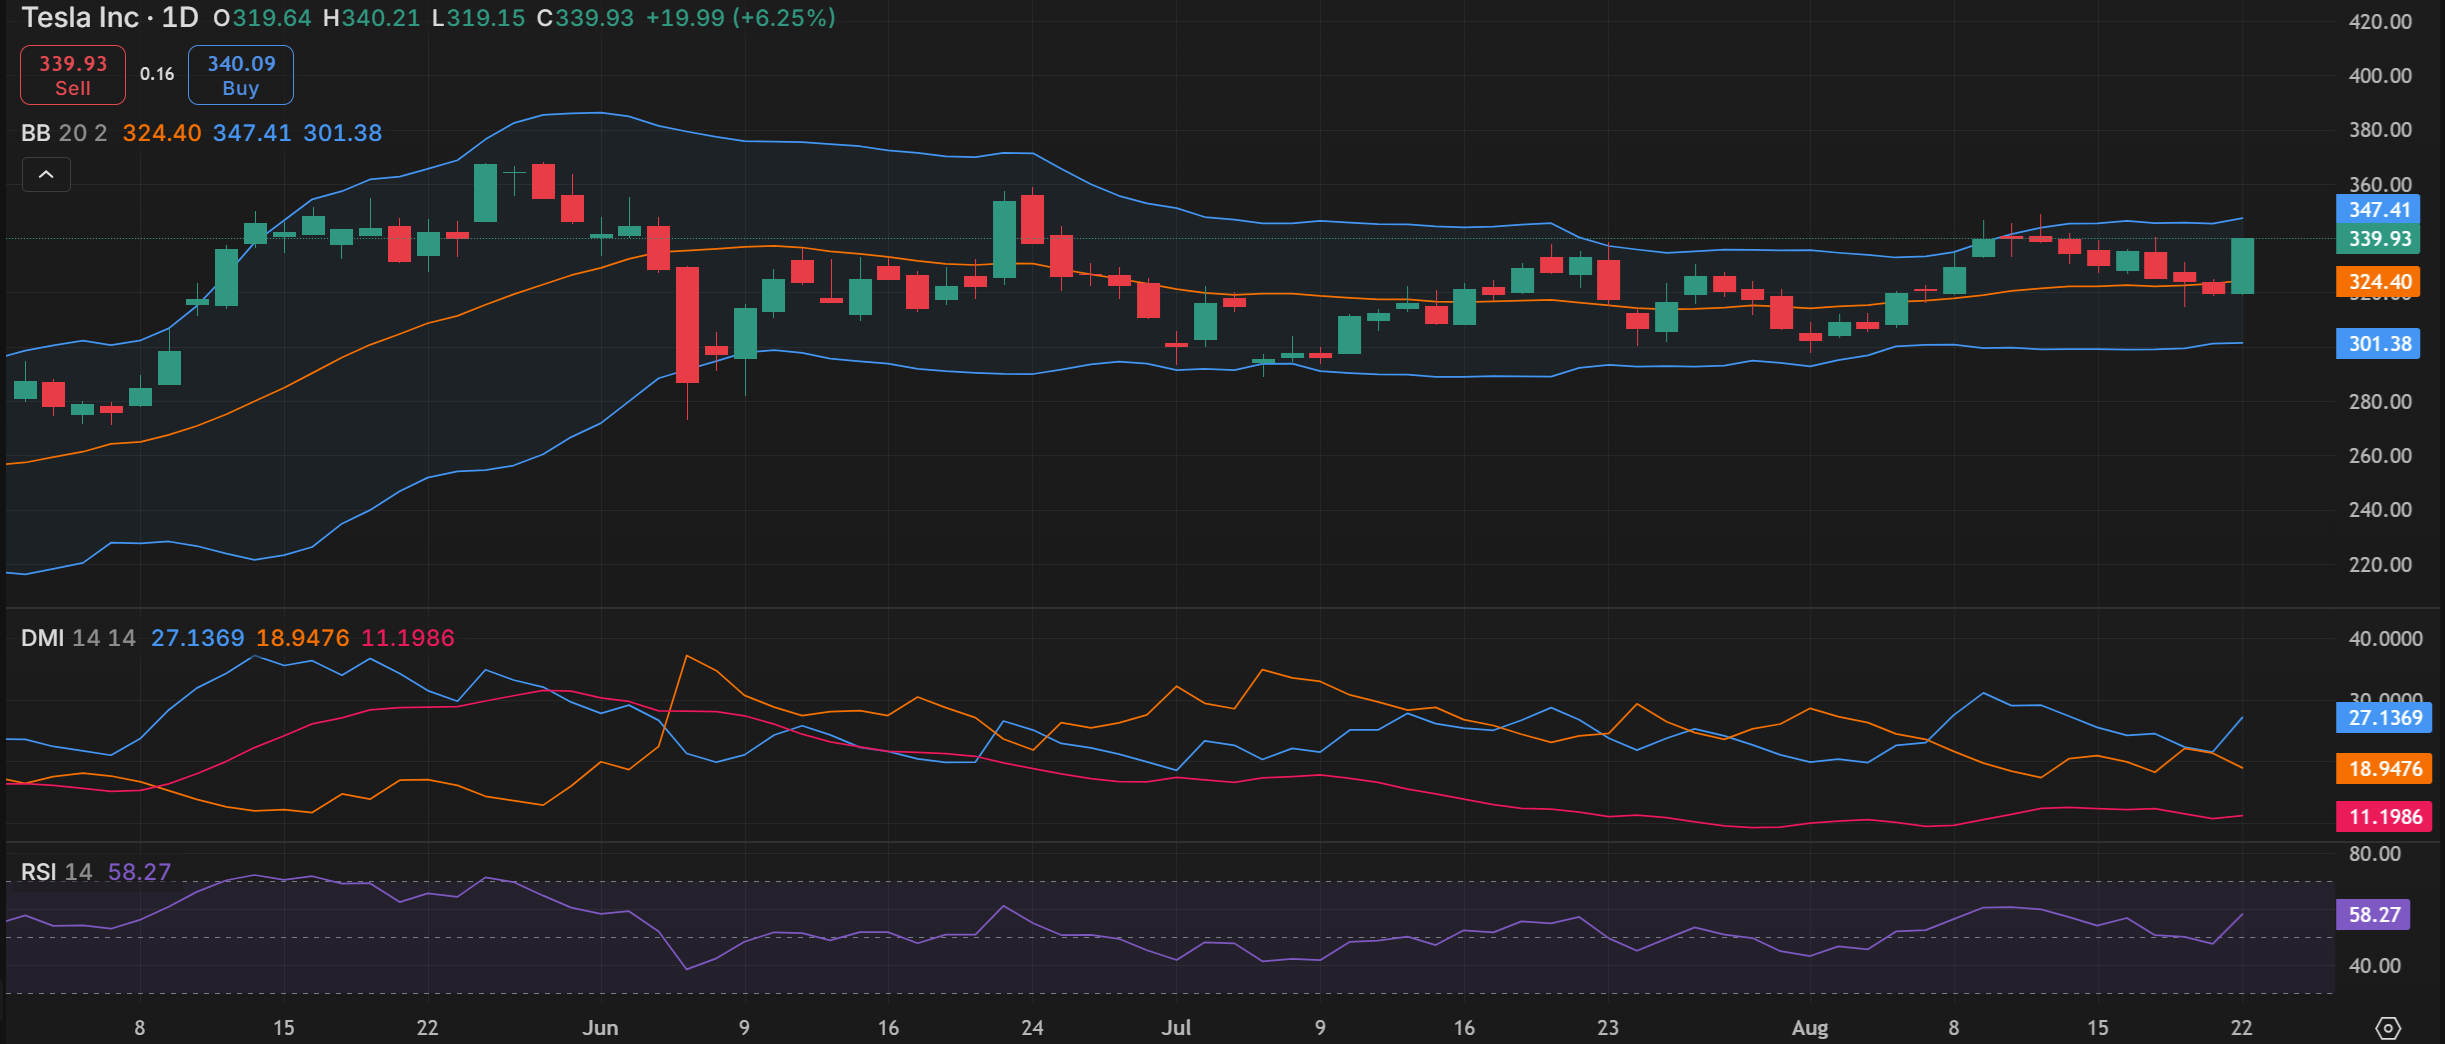
Source: Capital.com
Period: MAY 2025 – AUGUST 2025
Past performance is not an indicator of future results.