What is indices trading and how does it work?
Learn all about indices trading, with information on the types of indices, how they work, index trading hours, and more.
What is indices trading?
Indices trading is the buying and selling of stock market indices – including the US 500, UK 100 or Germany 40 – without owning the underlying shares. Each index represents the performance of a selected group of publicly listed companies, typically from a specific country, region or sector, and is often weighted by market capitalisation.
Rather than trading individual stocks, traders use indices to gain broader market exposure. Index prices rise or fall based on the weighted average performance of their constituent stocks, as well as broader market trends.
With indices, traders can speculate on the overall direction of an economy or sector, hedge existing positions, or take advantage of market volatility – all without needing to analyse or manage multiple single-stock positions.
What are the types of indices in trading?
Indices are broadly grouped into categories based on how they are constructed and what they represent, which includes: national indices, sector indices, volatility indices, and currency indices.
National indices
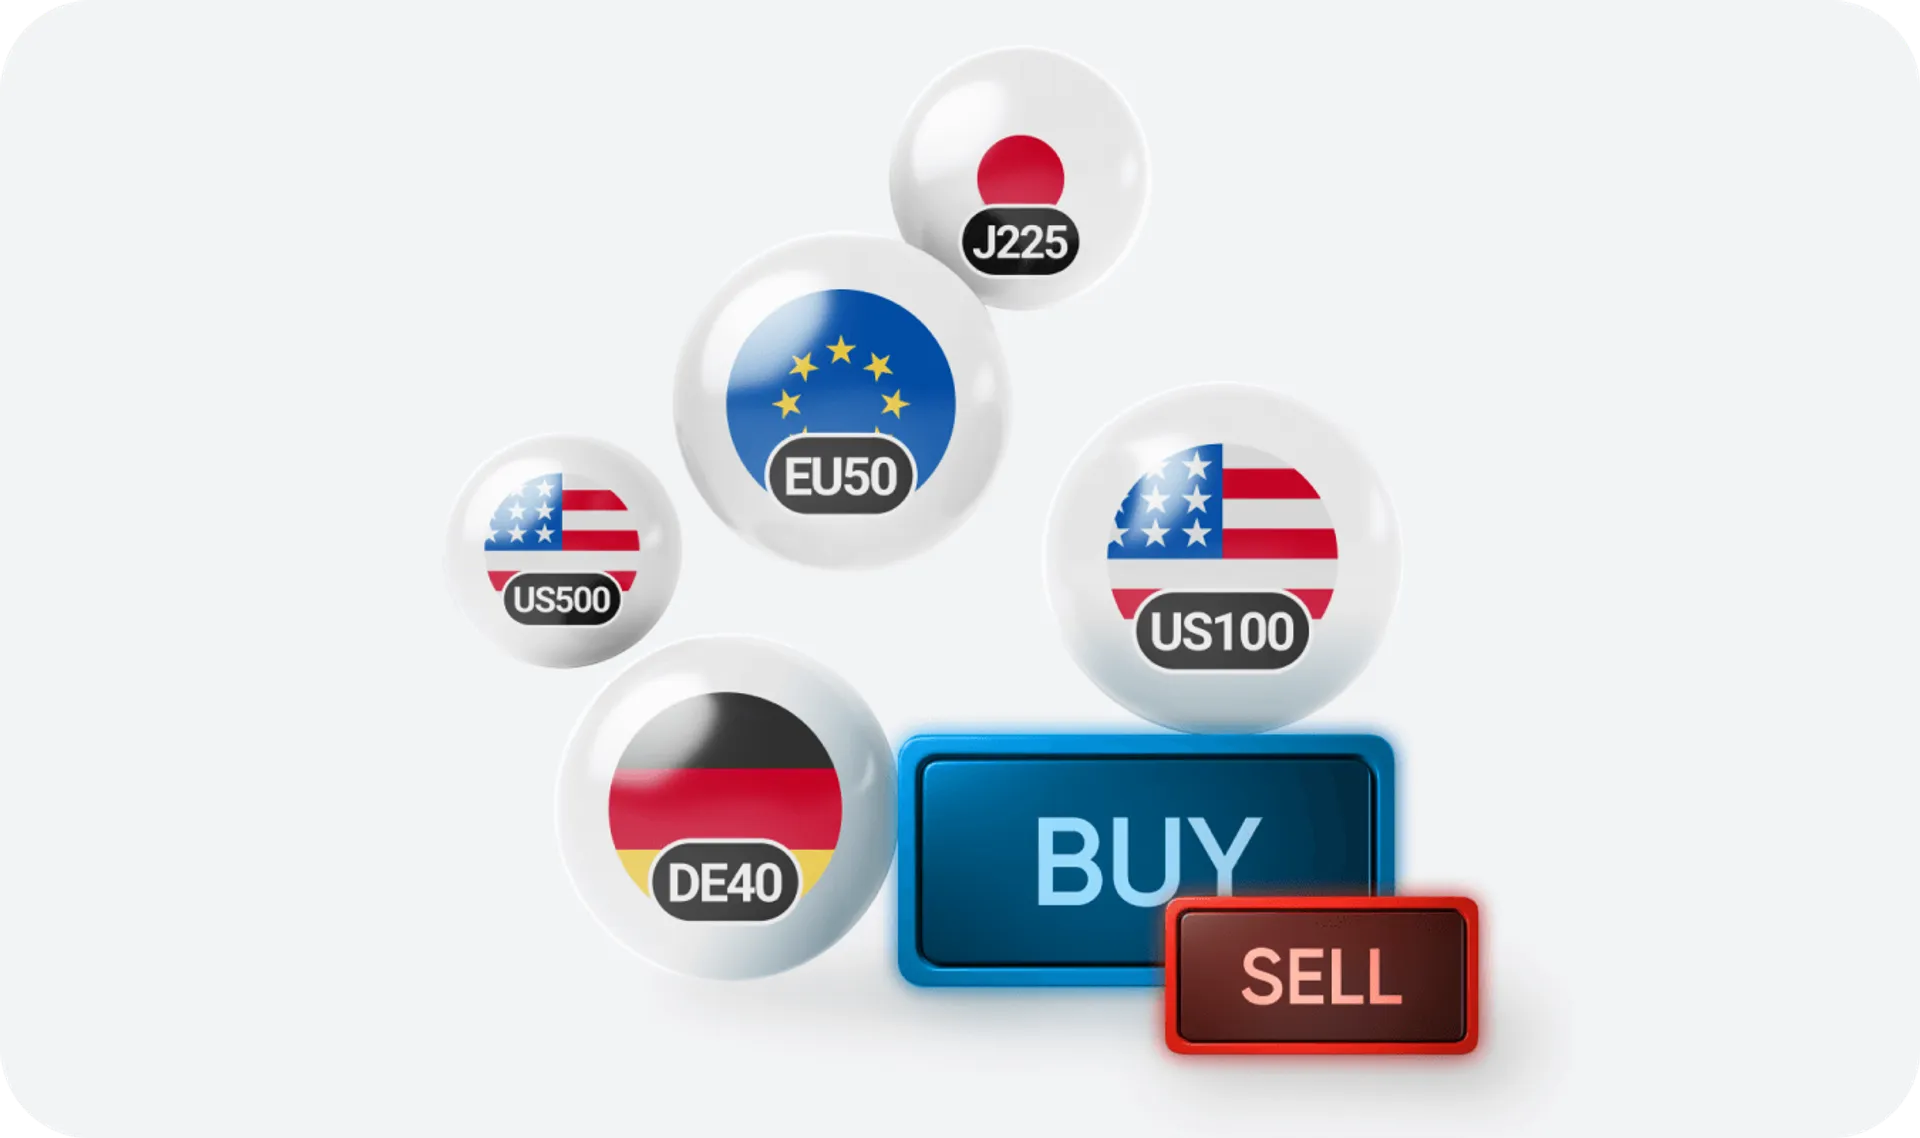
National indices track the performance of a selection of companies listed in a specific country. These include major benchmarks like the US 500 (S&P 500), UK 100 (FTSE 100), Germany 40 (DAX 40), and Japan 225 (Nikkei 225). Most national indices are weighted by market capitalisation, meaning larger companies have a greater impact on index price movements. Others, such as the US Wall Street 30 (Dow Jones), are price-weighted, where higher-priced stocks carry more influence.
Sector indices
Sector indices focus on particular segments of the economy, such as technology, energy, or healthcare. These indices reflect the performance of companies within a specific industry. . For example, the Hong Kong Tech Index tracks major technology firms listed in Hong Kong, while other indices may focus on financials, industrials, or consumer goods.
Volatility indices
Volatility indices, such as the Volatility Index (VIX), measure implied market volatility. These are based on the pricing of options and do not track company shares directly. They can help gauge market sentiment or hedge against risk.
Currency indices
Currency indices track the performance of a single currency against a weighted basket of others. For instance, the US Dollar Index (DXY) measures the value of the US dollar relative to six major currencies, including the euro, Japanese yen and British pound, with the euro carrying the heaviest weighting. Forex traders might use currency indices to assess currency strength or to hedge exposure.
How does indices trading work?
Indices are traded using derivatives such as contracts for difference (CFDs), wherein traders speculate on price movements without owning the underlying shares. Here’s how indices trading works.
‘Buy’ and ‘sell’ positions
When trading indices, you can take a long position if you believe the index will rise, or go short if you expect it to fall. For example, a trader expecting the US 500 to increase might go long using a CFD, aiming to profit from upward price movement. If the index falls instead, the trader would incur a loss.
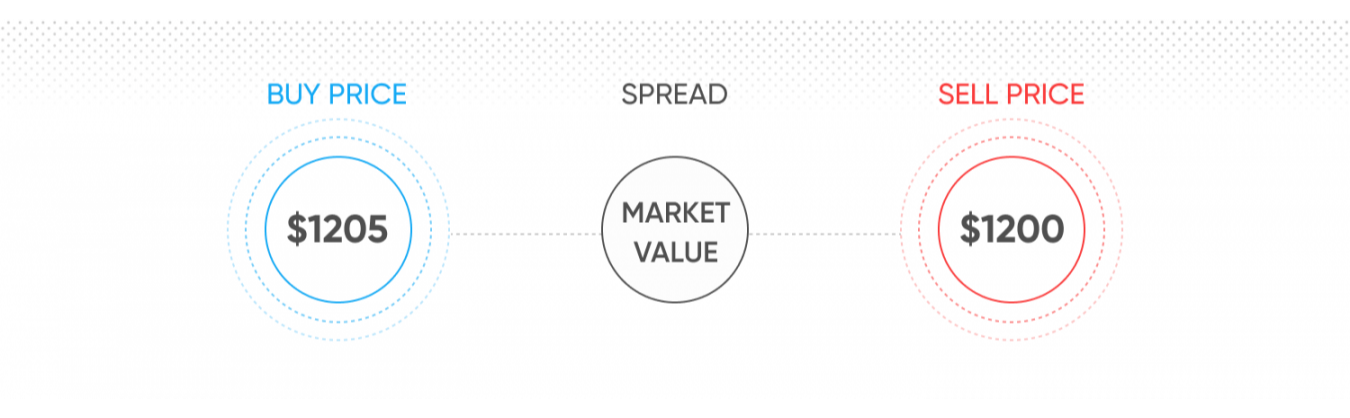
Spreads and trading costs
The primary cost of trading indices is the spread – the difference between the buy and sell price. You pay the spread when opening a position. There may also be overnight fees if you hold positions beyond the trading day, or additional charges for using risk management tools such as guaranteed stop-losses. Be aware of costs before opening a position on our charges and fees page.
Weighting and price movement
Each index has its own weighting method. Capitalisation-weighted indices – like the Germany 40 – give more influence to larger companies. Price-weighted indices, such as the US Wall Street 30, are influenced more by stocks with higher share prices, regardless of company size.
Leverage and margin
Index CFDs are traded on margin. This means you only need to deposit a fraction of the trade’s full value to open a position. While this can increase potential returns, it also magnifies potential losses, so it’s important to use it with caution.
Liquidity and execution
Major indices can experience high liquidity, especially during their core trading hours. High liquidity can result in tighter spreads and faster execution, making it easier to enter or exit trades at intended prices. However, periods of high volatility can still lead to slippage due to rapid price movements, even in otherwise liquid markets.
Market access
Indices can be traded via most CFD trading platforms on desktop or mobile. While trading may be available outside standard exchange hours, indices are typically most active during local market hours – for example, the US 500 is most active when US markets are open.
What is an example of indices trading?
Germany 40 CFD trade
Now let’s say you want to trade a CFD on the same market at a price of 16,000.
After conducting some fundamental analysis on the market, this time you think it will fall.
You open a short CFD position at €10 per point. This gives you a notional exposure of €160,000 (16,000 × €10). With a 5% margin requirement, you only have to put down €8,000.
Over a few hours, the price rises by 40 points to 16,040 and you close the position.
You’ve made a loss of €400 (40 × €10), plus the spread and any overnight funding charges, if applicable.
Conversely, had the price moved in line with your view and fallen 40 points to 15,960, the same position would have delivered a €400 profit, plus any applicable charges.
Where can you trade indices?
Indices trading is available through derivatives markets, accessed via regulated online brokers. Retail traders can speculate on index movements using instruments like contracts for difference (CFDs) without owning the underlying shares.
Key venues offering index-based instruments include:
- CME Group: trades major US indices such as the US 500 and US Tech 100.
- Eurex: offers European indices including the Germany 40 and EU Stocks 50.
- London Stock Exchange (LSE): supports trading in UK indices such as the UK 100.
- Osaka Exchange: trades contracts on the Japan 225.
- ASX (Australian Securities Exchange): offers indices such as the Australia 200.
Retail access to these markets is provided by online brokers offering trading platforms with live charts, adjustable trade sizes, and risk management tools like stop-losses and margin controls.
Learn more about CFDs in our contracts for difference (CFD) trading guide.
What are the indices market trading hours?
Indices trading hours depend on the local market hours of the underlying stock exchange. Here are the market trading hours (in UTC) for several major indices:
Summer trading hours
| Index | Exchange hours* | Our hours (via CFDs)** |
|---|---|---|
| US 500 | 1:30pm - 8pm | Sunday 12am - Friday 9pm |
| US Tech 100 | 1:30pm - 8pm | Sunday 12am - Friday 9pm |
| UK 100 | 7am - 3:30pm | Sunday 12am - Friday 9pm |
| Germany 40 | 7am - 3:30pm | Sunday 12am - Friday 9pm |
| Japan 225 | 12am - 6am | Sunday 12am - Friday 9pm |
| Australia 200 | 11pm - 5am | Sunday 12am - Friday 9pm |
*Monday to Friday
**Daily break 9pm to 10pm
Winter trading hours
| Index | Exchange hours* | Our hours (via CFDs)** |
|---|---|---|
| US 500 | 2:30pm - 9pm | Sunday 12am - Friday 9pm |
| US Tech 100 | 2:30pm - 9pm | Sunday 12am - Friday 9pm |
| UK 100 | 8am - 4:30pm | Sunday 12am - Friday 9pm |
| Germany 40 | 8am - 4:30pm | Sunday 12am - Friday 9pm |
| Japan 225 | 12am - 6am | Sunday 12am - Friday 9pm |
| Australia 200 | 12am - 6am | Sunday 12am - Friday 9pm |
*Monday to Friday
**Daily break 9pm to 10pm
Exchange hours reflect the official market sessions. However, many brokers offer extended trading via CFDs – typically from late Sunday evening to Friday night (UTC), with short maintenance breaks. This allows traders to access global indices throughout most of the trading week.
Get the latest indices trading hours on our stock market trading hours page.
Indices trading: What are the risks and benefits?
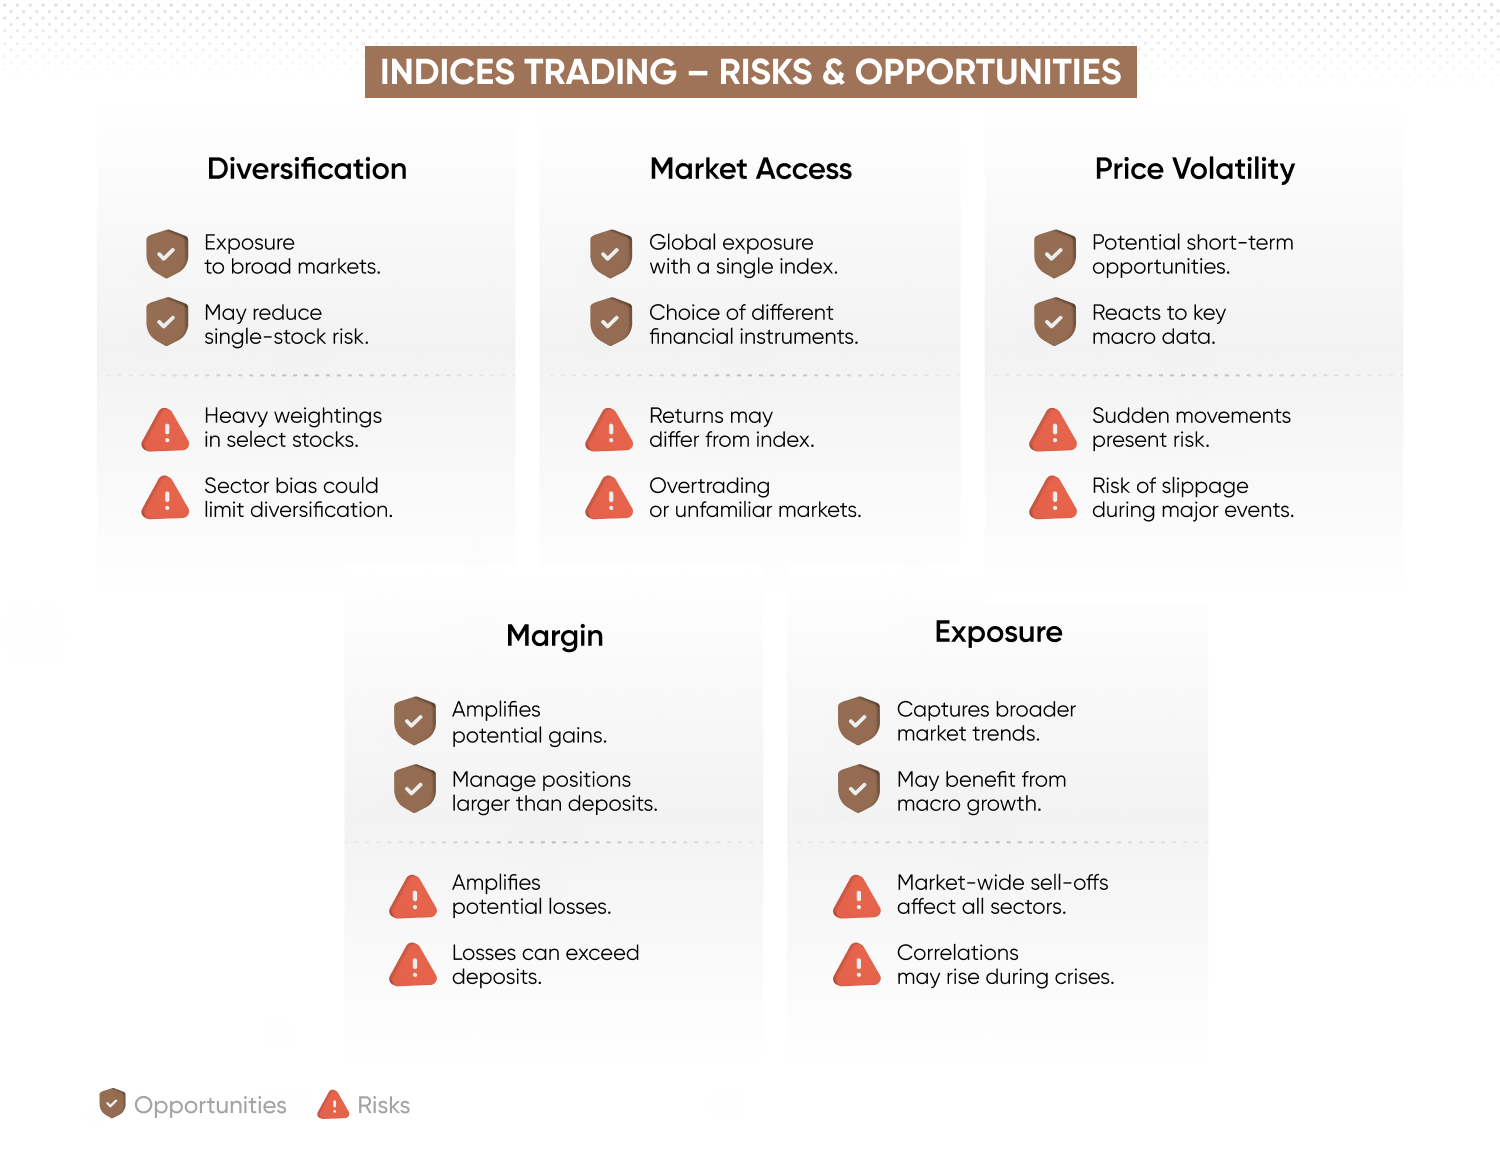
Indices trading carries both potential opportunities and risks, influenced by factors such as leverage, volatility, and market composition.
Diversification
Indices can give exposure to a basket of stocks, which may reduce company-specific risk. However, many indices are heavily weighted towards a few large firms or sectors, so diversification benefits can vary.
Market access
Indices trading via CFDs allows participation in global markets without owning shares. This provides flexibility and access across regions and time zones. However, it may also lead to overtrading or exposure to unfamiliar markets, and potential returns may differ slightly from the underlying index due to spreads, fees, or other trading costs.
Volatility
Indices can react sharply to economic data, interest rate decisions, and geopolitical events. Sudden price movements can create short-term opportunities, but also increase the risk of slippage and unexpected losses.
Leverage and margin
Leverage allows traders to open larger positions with a smaller deposit, magnifying both gains and losses. If your margin drops below the threshold, your broker may reduce or close positions – issuing a margin call if needed.
Systemic risk
Unlike individual stocks, indices reflect broader economic conditions. In market-wide sell-offs or periods of extreme uncertainty, correlations between assets can rise, which could limit the protective effect of diversification and heightening exposure to broader downturns.
What are some indices trading strategies?
Indices traders can use a variety of strategies, combining technical and fundamental analysis with effective risk management to identify potential opportunities.
Scalp trading strategy
Scalping is a short-term strategy where traders aim to profit from small price movements by placing multiple trades throughout the day. Positions are held for seconds or minutes, often using indicators such as moving averages, RSI or chart patterns on high-liquidity indices like the US 500 or Germany 40.
Trend trading strategy
Trend trading involves identifying and trading in the direction of a broader market move. Traders typically use tools such as MACD or moving averages to confirm trend strength before entering long or short positions on indices such as the UK 100 or US Tech 100.
Swing trading strategy
Swing traders hold positions for several days to weeks, aiming to capture medium-term price moves. Both technical and fundamental analysis are used to guide the timing of potential entry and exit points, often around key levels or economic data affecting index sentiment.
Range trading strategy
Range trading focuses on indices moving within a defined price band. Traders go long near support and short near resistance, using tools like Bollinger Bands or stochastic oscillators to identify reversal signals.
Discover more trading strategies on our comprehensive trading strategies page.
Need more support? Try our step-by-step indices course to guide you through the basics to the advanced concepts.
FAQ
What are indices in trading?
Indices (or indexes) in trading refer to benchmarks that track the performance of a group of stocks, selected based on factors such as market capitalisation, sector, or listing exchange. Traders can access indices via derivatives like contracts for difference (CFDs) to speculate on the overall direction of a market or economy, without trading individual shares. Examples include the US 500, UK 100 and Germany 40.
What are the top 5 indices?
The most widely traded indices globally include the US 500 (S&P 500), which tracks 500 large-cap US companies; the US Tech 100 (NASDAQ-100), comprising major non-financial firms; the UK 100 (FTSE 100), representing the largest companies listed on the London Stock Exchange; the Germany 40 (DAX 40), covering leading firms on the Frankfurt Stock Exchange; and the Japan 225 (Nikkei 225), which tracks 225 blue-chip companies listed in Tokyo.
How do I trade indices?
Indices are traded using derivatives such as CFDs. Traders go long if they expect the index to rise, or short if they expect it to fall. Positions can be opened and closed on online trading platforms, with tools available for leverage, risk management and real-time analysis.
Curious about trading other assets?
Share trading
Trade price movements of the biggest companies without needing to own the stock itself.
Commodity trading
Why are traders so attracted to trading gold and oil? Find out more about these and other commodities.
Forex trading
Find out more about the world’s most-liquid market and why so many people trade it.