CFDs are complex instruments and come with a high risk of losing money rapidly due to leverage. 79% of retail investor accounts lose money when trading CFDs with this provider. You should consider whether you understand how CFDs work and whether you can afford to take the high risk of losing your money.
US English

Trade Lvmh Moet Hennessy Louis Vuitton Se - MC CFD

701.95
0.46%
Market Trading Hours* (UTC) Open now
Closes on Monday at 16:30

Mon - Fri: 08:00 - 16:30

  • Summary
  • Historical Data
  • Events
  • Income Statement
  • Balance Sheet
  • Cash Flow
  • Ownership
Trading Conditions
Spread 1.80
Long position overnight fee

Long position overnight fee


Margin. Your investment $1,000.00
Overnight fee -0.022046 %
Charges from full value of position ($-4.19)
Trade size with leverage ~ $20,000.00
Money from leverage ~ $19,000.00

Go to platform
-0.022046%
Short position overnight fee

Short position overnight fee


Margin. Your investment $1,000.00
Overnight fee -0.000176 %
Charges from full value of position ($-0.03)
Trade size with leverage ~ $20,000.00
Money from leverage ~ $19,000.00

Go to platform
-0.000176%
Overnight fee time 22:00 (UTC)
Min traded quantity 0.1
Currency EUR
Margin 5%
Stock exchange France
Commission on trade 0%

*Information provided by Capital.com

LVMH Moet Hennessy Louis Vuitton SE ESG Risk Ratings

High Medium Low Negligible

‘B’ score indicates good relative ESG performance and above average degree of transparency in reporting material ESG data publicly.

More ESG coverage

Key Stats
Prev. Close* 696.65
Open* 692.35
1-Year Change* -2.88%
Day's Range* 692.35 - 699.85
52 wk Range 655.00-904.60
Average Volume (10 days) 371.30K
Average Volume (3 months) 8.65M
Market Cap 357.61B
P/E Ratio 22.27
Shares Outstanding 499.41M
Revenue 84.70B
EPS 31.98
Dividend (Yield %) 1.75488
Beta 1.01
Next Earnings Date Jan 24, 2024

All data is provided by Refinitiv, except for data marked with an asterisk, which is *data provided by Capital.com

  • Last Week
  • Last Month
  • Last Year
  • Last two Years
  • Max
  • Daily
  • Weekly
  • Monthly
Date Close Change Change (%) Open High Low
Dec 1, 2023 696.65 8.20 1.19% 688.45 704.15 688.05
Nov 30, 2023 699.95 8.00 1.16% 691.95 702.25 681.25
Nov 29, 2023 690.65 6.90 1.01% 683.75 695.95 680.55
Nov 28, 2023 684.15 2.90 0.43% 681.25 686.05 675.30
Nov 27, 2023 696.65 -9.60 -1.36% 706.25 709.35 695.45
Nov 24, 2023 705.75 -3.90 -0.55% 709.65 710.15 703.75
Nov 23, 2023 709.95 -2.80 -0.39% 712.75 713.65 705.95
Nov 22, 2023 711.35 6.50 0.92% 704.85 713.25 701.95
Nov 21, 2023 703.15 -4.20 -0.59% 707.35 710.15 701.75
Nov 20, 2023 717.25 5.30 0.74% 711.95 719.85 711.15
Nov 17, 2023 710.55 5.70 0.81% 704.85 714.55 704.35
Nov 16, 2023 704.25 -6.60 -0.93% 710.85 711.55 698.75
Nov 15, 2023 717.05 4.90 0.69% 712.15 725.85 711.35
Nov 14, 2023 707.55 23.40 3.42% 684.15 709.65 684.15
Nov 13, 2023 687.45 -4.00 -0.58% 691.45 692.05 682.05
Nov 10, 2023 686.35 -14.50 -2.07% 700.85 703.95 679.80
Nov 9, 2023 715.45 12.20 1.73% 703.25 717.35 701.05
Nov 8, 2023 704.05 7.90 1.13% 696.15 709.35 692.15
Nov 7, 2023 695.75 2.40 0.35% 693.35 698.95 690.25
Nov 6, 2023 696.15 -10.20 -1.44% 706.35 707.45 692.15

Lvmh Moet Hennessy Louis Vuitton Se Events

Time (UTC) Country Event
Monday, December 4, 2023

Time (UTC)

12:00

Country

FR

Event

LVMH Moet Hennessy Louis Vuitton SE

Forecast

-

Previous

-
Wednesday, January 24, 2024

Time (UTC)

15:00

Country

FR

Event

Full Year 2023 LVMH Moet Hennessy Louis Vuitton SE Earnings Release

Forecast

-

Previous

-
Thursday, April 18, 2024

Time (UTC)

10:59

Country

FR

Event

LVMH Moet Hennessy Louis Vuitton SE Annual Shareholders Meeting

Forecast

-

Previous

-
View all events
  • Annual
  • Quarterly
2022 2021 2020 2019 2018
Total revenue 79184 64215 44651 53670 46826
Revenue 79184 64215 44651 53670 46826
Cost of Revenue, Total 24988 20355 15871 18123 15625
Gross Profit 54196 43860 28780 35547 31201
Total Operating Expense 58183 47060 36679 42397 36949
Selling/General/Admin. Expenses, Total 33178 26722 20433 24071 21221
Interest Expense (Income) - Net Operating -269 -132 42 -28 -23
Unusual Expense (Income) 282 98 298 128 131
Other Operating Expenses, Total 4 17 35 103 -5
Operating Income 21001 17155 7972 11273 9877
Interest Income (Expense), Net Non-Operating -846 102 -570 -537 -367
Other, Net -42 -49 -38 -22 -21
Net Income Before Taxes 20113 17208 7364 10714 9489
Net Income After Taxes 14751 12698 4955 7782 6990
Minority Interest -667 -662 -253 -611 -636
Net Income Before Extra. Items 14084 12036 4702 7171 6354
Net Income 14084 12036 4702 7171 6354
Income Available to Common Excl. Extra. Items 14084 12036 4702 7171 6354
Income Available to Common Incl. Extra. Items 14084 12036 4702 7171 6354
Diluted Net Income 14084 12036 4702 7171 6354
Diluted Weighted Average Shares 502.48 503.896 504.21 503.84 503.918
Diluted EPS Excluding Extraordinary Items 28.029 23.8859 9.32548 14.2327 12.6092
Dividends per Share - Common Stock Primary Issue 12 10 6 4.8 6
Diluted Normalized EPS 28.4406 24.0294 9.97671 14.4172 12.8007
Jun 2023 Dec 2022 Jun 2022 Dec 2021 Jun 2021
Total revenue 42240 42455 36729 35550 28665
Revenue 42240 42455 36729 35550 28665
Cost of Revenue, Total 12923 13570 11418 11246 9109
Gross Profit 29317 28885 25311 24304 19556
Total Operating Expense 30676 31581 26602 25993 21067
Selling/General/Admin. Expenses, Total 17738 18099 15079 14819 11903
Interest Expense (Income) - Net Operating 5 -266 -3 -153 21
Unusual Expense (Income) 13 174 108 64 34
Other Operating Expenses, Total -3 4 0 17 0
Operating Income 11564 10874 10127 9557 7598
Interest Income (Expense), Net Non-Operating 492 -72 -774 92 10
Other, Net -25 -18 -24 -27 -22
Net Income Before Taxes 12031 10784 9329 9622 7586
Net Income After Taxes 8902 7807 6944 7122 5576
Minority Interest -421 -255 -412 -375 -287
Net Income Before Extra. Items 8481 7552 6532 6747 5289
Net Income 8481 7552 6532 6747 5289
Income Available to Common Excl. Extra. Items 8481 7552 6532 6747 5289
Income Available to Common Incl. Extra. Items 8481 7552 6532 6747 5289
Diluted Net Income 8481 7552 6532 6747 5289
Diluted Weighted Average Shares 500.79 501.937 503.023 503.761 504.03
Diluted EPS Excluding Extraordinary Items 16.9353 15.0457 12.9855 13.3933 10.4934
Dividends per Share - Common Stock Primary Issue 5.5 7 5 7 3
Diluted Normalized EPS 16.9545 15.2967 13.1453 13.4873 10.543
  • Annual
  • Quarterly
2022 2021 2020 2019 2018
Total Current Assets 39740 34301 39973 26510 23551
Cash and Short Term Investments 10852 10565 20715 6406 5276
Cash 6013 5716 4474 4647 3764
Cash & Equivalents 1287 2305 15489 1026 846
Short Term Investments 3552 2544 752 733 666
Total Receivables, Net 7110 6112 4678 5500 5021
Accounts Receivable - Trade, Net 4258 3787 2756 3450 3222
Total Inventory 20319 16549 13016 13717 12485
Prepaid Expenses 999 818 596 708 646
Other Current Assets, Total 460 257 968 179 123
Total Assets 134646 125311 108671 96507 74300
Property/Plant/Equipment, Total - Net 36953 33270 30115 30261 14510
Property/Plant/Equipment, Total - Gross 62628 55481 47240 44933 25686
Accumulated Depreciation, Total -25675 -22211 -17124 -14671 -11176
Goodwill, Net 24782 25904 16042 16034 13727
Intangibles, Net 25715 24858 17325 17574 17254
Long Term Investments 3163 3250 2454 2737 2719
Note Receivable - Long Term 444 413 280 291 303
Other Long Term Assets, Total 3849 3315 2482 3100 2236
Total Current Liabilities 31543 27989 25318 22623 16833
Accounts Payable 8788 7086 5098 5814 5314
Accrued Expenses 4035 3632 2518 2682 2477
Notes Payable/Short Term Debt 7591 4566 9149 5474 3766
Current Port. of LT Debt/Capital Leases 4340 5835 3603 4287 1242
Other Current Liabilities, Total 6789 6870 4950 4366 4034
Total Liabilities 79535 78192 71259 59921 42007
Total Long Term Debt 23156 24052 24730 15474 6005
Long Term Debt 10380 12165 14065 5101 5690
Capital Lease Obligations 12776 11887 10665 10373 315
Deferred Income Tax 6952 6704 5481 5498 5036
Minority Interest 1493 1790 1417 1779 1664
Other Liabilities, Total 16391 17657 14313 14547 12469
Total Equity 55111 47119 37412 36586 32293
Common Stock 151 152 152 152 152
Additional Paid-In Capital 1289 2225 2225 2319 2298
Retained Earnings (Accumulated Deficit) 51092 43399 35363 32843 28816
Treasury Stock - Common -1293 -912 -260 -403 -421
Unrealized Gain (Loss) 1125 1167 1139 1140 1117
Other Equity, Total 2747 1088 -1207 535 331
Total Liabilities & Shareholders’ Equity 134646 125311 108671 96507 74300
Total Common Shares Outstanding 501.077 503.191 503.896 503.652 502.894
Jun 2023 Dec 2022 Jun 2022 Dec 2021 Jun 2021
Total Current Assets 42002 39740 37291 34301 30614
Cash and Short Term Investments 10368 10852 10397 10565 8700
Cash 5023 6013 6187 5716 5117
Cash & Equivalents 1122 1287 1712 2305 2114
Short Term Investments 4223 3552 2498 2544 1469
Total Receivables, Net 7090 7110 6639 6112 4783
Accounts Receivable - Trade, Net 4173 4258 4078 3787 2950
Total Inventory 22638 20319 18920 16549 16054
Prepaid Expenses 1071 999 945 818 650
Other Current Assets, Total 835 460 390 257 427
Total Assets 139375 134646 131309 125311 116586
Property/Plant/Equipment, Total - Net 39008 36953 35090 33270 32536
Property/Plant/Equipment, Total - Gross 65592 62628 59867 55481 53076
Accumulated Depreciation, Total -26585 -25675 -24777 -22211 -20541
Goodwill, Net 25102 24782 25551 25904 29928
Intangibles, Net 25606 25715 25711 24858 17565
Long Term Investments 3339 3163 3291 3250 2730
Note Receivable - Long Term 323 444 463 413 361
Other Long Term Assets, Total 3995 3849 3912 3315 2852
Total Current Liabilities 34290 31543 31934 27989 27929
Accounts Payable 8224 8788 7569 7086 5662
Accrued Expenses 3270 4035 3042 3632 2460
Notes Payable/Short Term Debt 11209 7591 9106 4566 8733
Current Port. of LT Debt/Capital Leases 5268 4340 4539 5835 5784
Other Current Liabilities, Total 6319 6789 7678 6870 5290
Total Liabilities 81658 79535 80555 78192 75403
Total Long Term Debt 21822 23156 23132 24052 23982
Long Term Debt 8923 10380 10520 12165 11937
Capital Lease Obligations 12899 12776 12612 11887 12045
Deferred Income Tax 7197 6952 6982 6704 5491
Minority Interest 1732 1493 1959 1790 1441
Other Liabilities, Total 16617 16391 16548 17657 16560
Total Equity 57717 55111 50754 47119 41183
Common Stock 151 151 152 152 152
Additional Paid-In Capital 530 1289 2225 2225 2225
Retained Earnings (Accumulated Deficit) 55779 51092 46232 43399 38427
Treasury Stock - Common -1987 -1293 -2270 -912 -493
Unrealized Gain (Loss) 1126 1125 1167 1167 1139
Other Equity, Total 2118 2747 3248 1088 -267
Total Liabilities & Shareholders’ Equity 139375 134646 131309 125311 116586
Total Common Shares Outstanding 499.41 501.077 500.863 503.191 503.785
  • Annual
  • Quarterly
2022 2021 2020 2019 2018
Net income/Starting Line 21001 17155 7972 11273 9877
Cash From Operating Activities 17833 18648 10897 11648 8490
Cash From Operating Activities 6226 5830 6050 5108 2302
Non-Cash Items -457 -364 -25 -276 -214
Cash Taxes Paid 5933 4464 2501 3070 2314
Cash Interest Paid 314 231 348 363 113
Changes in Working Capital -8937 -3973 -3100 -4457 -3475
Cash From Investing Activities -5920 -15979 -2939 -5869 -3439
Capital Expenditures -5082 -2664 -2465 -3388 -3141
Other Investing Cash Flow Items, Total -838 -13315 -474 -2481 -298
Cash From Financing Activities -12685 -15156 7403 -4734 -4323
Financing Cash Flow Items -3464 -2380 -336 -325 -758
Total Cash Dividends Paid -6353 -4161 -2434 -3249 -2715
Issuance (Retirement) of Stock, Net -205
Issuance (Retirement) of Debt, Net -2868 -8615 10173 -1160 -645
Foreign Exchange Effects 55 498 -1052 39 67
Net Change in Cash -717 -11989 14309 1084 795
Dec 2022 Jun 2022 Dec 2021 Jun 2021
Net income/Starting Line 21001 10127 17155 7598
Cash From Operating Activities 17833 7266 18648 7722
Cash From Operating Activities 6226 3006 5830 2744
Non-Cash Items -457 -201 -364 -173
Cash Taxes Paid 5933 2880 4464 1658
Cash Interest Paid 314 137 231 132
Changes in Working Capital -8937 -5666 -3973 -2447
Cash From Investing Activities -5920 -2044 -15979 -13969
Capital Expenditures -5082 -1769 -2664 -1141
Other Investing Cash Flow Items, Total -838 -275 -13315 -12828
Cash From Financing Activities -12685 -5834 -15156 -6759
Financing Cash Flow Items -3464 -1791 -2380 -1395
Total Cash Dividends Paid -6353 -3761 -4161 -2084
Issuance (Retirement) of Debt, Net -2868 -282 -8615 -3280
Foreign Exchange Effects 55 294 498 115
Net Change in Cash -717 -318 -11989 -12891
Investor Name Investor Type Percent Outstanding Shares Held Shares change Holdings Date Turnover Rating
Arnault Family Other Insider Investor 48.2988 242483355 236666 2022-12-31 LOW
Capital Research Global Investors Investment Advisor 2.104 10562867 -370534 2023-09-30 LOW
The Vanguard Group, Inc. Investment Advisor/Hedge Fund 1.4806 7433186 11154 2023-09-30 LOW
Norges Bank Investment Management (NBIM) Sovereign Wealth Fund 1.1491 5769059 287567 2022-12-31 LOW
BlackRock Institutional Trust Company, N.A. Investment Advisor 1.0366 5203992 -33149 2023-09-30 LOW
Fidelity Management & Research Company LLC Investment Advisor 0.7154 3591546 0 2023-09-30 LOW
Capital World Investors Investment Advisor 0.7099 3564214 -56268 2023-09-30 LOW
MFS Investment Management Investment Advisor/Hedge Fund 0.6914 3471270 9811 2023-09-30 LOW
Amundi Asset Management, SAS Investment Advisor/Hedge Fund 0.604 3032427 54674 2023-09-30 LOW
BlackRock Investment Management (UK) Ltd. Investment Advisor/Hedge Fund 0.549 2756065 -2184 2023-09-30 LOW
BlackRock Advisors (UK) Limited Investment Advisor/Hedge Fund 0.4762 2390551 10304 2023-09-30 LOW
Fundsmith LLP Investment Advisor 0.4392 2205211 0 2023-04-30 LOW
Jennison Associates LLC Investment Advisor/Hedge Fund 0.3292 1652865 -87702 2023-09-30 LOW
Geode Capital Management, L.L.C. Investment Advisor/Hedge Fund 0.3289 1651415 420 2023-09-30 LOW
Invesco Advisers, Inc. Investment Advisor 0.2996 1503995 -6970 2023-09-30 LOW
Janus Henderson Investors Investment Advisor/Hedge Fund 0.2171 1089812 4388 2023-09-30 LOW
Allianz Global Investors GmbH Investment Advisor 0.213 1069463 -4163 2023-09-30 LOW
Nuveen LLC Pension Fund 0.208 1044437 11602 2023-09-30 LOW
JPMorgan Asset Management U.K. Limited Investment Advisor/Hedge Fund 0.2038 1023343 -41838 2023-09-30 LOW
GQG Partners, LLC Investment Advisor 0.1995 1001467 -21064 2023-09-30 MED

Trading calculator

Calculate your hypothetical P&L if you had opened a CFD trade on a certain date (select a date) and closed on a different date (select a date).

Trade commission
0
  • 1:1
Leverage
1:1
  • 20
  • 100
  • 500
  • 1000
  • 10000
Investment
Trade size (Leverage x Investement):
Open

Close

Short Long

For the avoidance of doubt, this calculation does not include the costs of holding a position overnight (for which there will be additional charges)

LVMH Company profile

About LVMH Moet Hennessy Louis Vuitton SE

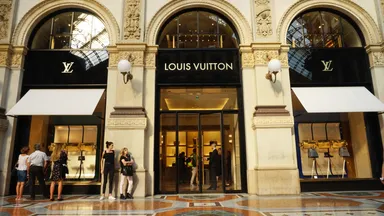
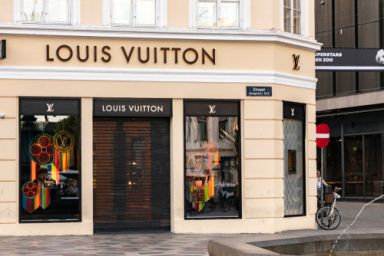
LVMH Moet Hennessy Louis Vuitton SE is a France-based luxury group active in six sectors: Wines and Spirits, Fashion and Leather Goods, Perfumes and Cosmetics, Watches and Jewelry, Selective Retailing and Other Activities. Wines and Spirits owns brands, such as Moet & Chandon, Krug, Veuve Clicquot, Hennessy and Chteau d’Yquem, among others. Fashion and Leather Goods owns brands, such as Luis Vuitton, Christian Dior and Givenchy, among others. Perfumes and Cosmetics owns brands, such as Parfums Christian Dior, Parfums Givenchy Guerlain, Benefit Cosmetics, Fresh and Make Up For Ever, among others. Watches and Jewelry owns brands, including TAG Heuer, Hublo, Zenith, Bulgari, Chaumet and Fred, among others. Selective Retailing owns the brands DFS, Miami Cruiseline, Sephora and Le Bon Marche Rive Gauche, among others. Other Activities includes lifestyle, culture and the arts brands, such as Les Echos, Royal Van Lent, and Cheval Blanc. The Company is active worldwide.

Financial summary

BRIEF: For the fiscal year ended 31 December 2021, LVMH Moet Hennessy Louis Vuitton SE revenues increased 44% to EUR64.22B. Net income increased from EUR4.7B to EUR12.04B. Revenues reflect Fashion and Leather Goods segment increase of 46% to EUR30.84B, Watches and Jewelry segment increase from EUR3.32B to EUR8.87B, Asia (excluding Japan) segment increase of 46% to EUR22.37B, United States segment increase of 56% to EUR16.59B.

Industry: Apparel & Accessories (NEC)

22, avenue Montaigne
PARIS
ILE-DE-FRANCE 75008
FR

Income Statement

  • Annual
  • Quarterly

News

CPI drops more than expected in Europe, Spain’s IBEX 35 looking to break pre-COVID highs

CPI drops more than expected in Europe, Spain’s IBEX 35 looking to break pre-COVID highs

12:39, 30 November 2023

Euro Zone CPI expected to continue dropping; economists warn about cutting too soon

EZ PI expected to drop further but speed of decline

08:16, 29 November 2023

A weaker Dollar drives gold higher

Gold prices have returned above $US2000 per ounce. We run through the factors driving gold and the commodity’s key technicals.

13:49, 28 November 2023

Q3 US Earnings Recap: Profits surprise to the upside, but outlook remains uncertain

US earnings for the third quarter were far better than expected. However, uncertainty about the outlook for company profits continues. We review the quarterly earnings and look ahead to what the markets expect from S&P 500 companies going forward.

13:20, 28 November 2023

RBNZ Preview: Rates expected to remain unchanged at final meeting of 2023

The RBNZ meets for the final time this year on Wednesday, 29th of November, 2023. We preview what to expect and how it could impact the New Zealand Dollar.

13:04, 28 November 2023

Crude prices slide on OPEC+ uncertainty

Crude prices have chopped sideways amid signs of turmoil within OPEC+. We look at the fundamentals of the oil market and the technical levels of WTI.

12:55, 28 November 2023
GBP

UK AUTUMN BUDGET: Will Hunt cut taxes? How will GBP react this time around?

UK Chancellor Hunt will deliver the 2023 autumn statement to MPs on Wednesday 22 November.

10:48, 21 November 2023

People also watch

XRP/USD

0.65 Price
+2.670% 1D Chg, %
Long position overnight fee -0.0753%
Short position overnight fee 0.0069%
Overnight fee time 22:00 (UTC)
Spread 0.01168

Gold

2,064.89 Price
-0.390% 1D Chg, %
Long position overnight fee -0.0193%
Short position overnight fee 0.0111%
Overnight fee time 22:00 (UTC)
Spread 0.30

US100

15,955.30 Price
-0.400% 1D Chg, %
Long position overnight fee -0.0262%
Short position overnight fee 0.0040%
Overnight fee time 22:00 (UTC)
Spread 1.8

BTC/USD

41,604.85 Price
+4.380% 1D Chg, %
Long position overnight fee -0.0616%
Short position overnight fee 0.0137%
Overnight fee time 22:00 (UTC)
Spread 106.00

Still looking for a broker you can trust?

Join the 570.000+ traders worldwide that chose to trade with Capital.com

1. Create & verify your account 2. Make your first deposit 3. You’re all set. Start trading