CFDs are complex instruments and come with a high risk of losing money rapidly due to leverage. 79% of retail investor accounts lose money when trading CFDs with this provider. You should consider whether you understand how CFDs work and whether you can afford to take the high risk of losing your money.
US English

Trade Intuitive Surgical, Inc. - ISRG CFD

310.21
0.31%
Market Trading Hours* (UTC) Opens on Thursday at 14:30

Mon - Fri: 14:30 - 21:00

  • Summary
  • Historical Data
  • Events
  • Income Statement
  • Balance Sheet
  • Cash Flow
  • Ownership
Trading Conditions
Spread 0.24
Long position overnight fee

Long position overnight fee


Margin. Your investment $1,000.00
Overnight fee -0.026346 %
Charges from full value of position ($-5.01)
Trade size with leverage ~ $20,000.00
Money from leverage ~ $19,000.00

Go to platform
-0.026346%
Short position overnight fee

Short position overnight fee


Margin. Your investment $1,000.00
Overnight fee 0.004124 %
Charges from full value of position ($0.78)
Trade size with leverage ~ $20,000.00
Money from leverage ~ $19,000.00

Go to platform
0.004124%
Overnight fee time 22:00 (UTC)
Min traded quantity 1
Currency USD
Margin 5%
Stock exchange United States of America
Commission on trade 0%

*Information provided by Capital.com

Intuitive Surgical Inc ESG Risk Ratings

High Medium Low Negligible

‘B’ score indicates good relative ESG performance and above average degree of transparency in reporting material ESG data publicly.

More ESG coverage

Key Stats
Prev. Close* 309.26
Open* 308.7
1-Year Change* 14.46%
Day's Range* 308.7 - 313.13
52 wk Range 222.65-358.07
Average Volume (10 days) 1.83M
Average Volume (3 months) 40.71M
Market Cap 109.78B
P/E Ratio 73.43
Shares Outstanding 352.07M
Revenue 6.85B
EPS 4.25
Dividend (Yield %) N/A
Beta 1.35
Next Earnings Date Jan 22, 2024

All data is provided by Refinitiv, except for data marked with an asterisk, which is *data provided by Capital.com

  • Last Week
  • Last Month
  • Last Year
  • Last two Years
  • Max
  • Daily
  • Weekly
  • Monthly
Date Close Change Change (%) Open High Low
Dec 6, 2023 310.21 -0.24 -0.08% 310.45 313.42 307.39
Dec 5, 2023 309.26 -1.69 -0.54% 310.95 311.22 303.53
Dec 4, 2023 311.74 0.74 0.24% 311.00 315.14 308.67
Dec 1, 2023 315.12 5.75 1.86% 309.37 315.59 308.29
Nov 30, 2023 310.25 -0.46 -0.15% 310.71 311.66 303.52
Nov 29, 2023 310.66 0.10 0.03% 310.56 316.17 309.46
Nov 28, 2023 310.75 -0.24 -0.08% 310.99 312.64 308.95
Nov 27, 2023 314.92 0.54 0.17% 314.38 315.76 311.86
Nov 24, 2023 317.70 1.60 0.51% 316.10 318.00 315.54
Nov 22, 2023 315.62 1.73 0.55% 313.89 317.21 313.35
Nov 21, 2023 311.74 1.78 0.57% 309.96 312.09 307.83
Nov 20, 2023 311.27 6.17 2.02% 305.10 312.10 304.08
Nov 17, 2023 305.08 0.65 0.21% 304.43 311.07 304.41
Nov 16, 2023 303.86 7.41 2.50% 296.45 305.13 294.01
Nov 15, 2023 293.20 1.86 0.64% 291.34 297.17 291.06
Nov 14, 2023 291.60 4.50 1.57% 287.10 294.02 287.10
Nov 13, 2023 282.40 0.01 0.00% 282.39 289.46 280.74
Nov 10, 2023 277.49 6.80 2.51% 270.69 278.41 269.13
Nov 9, 2023 272.19 -3.96 -1.43% 276.15 278.35 271.70
Nov 8, 2023 277.79 -1.30 -0.47% 279.09 282.25 276.37

Intuitive Surgical, Inc. Events

Time (UTC) Country Event
Monday, January 22, 2024

Time (UTC)

10:59

Country

US

Event

Q4 2023 Intuitive Surgical Inc Earnings Release

Forecast

-

Previous

-
Tuesday, April 16, 2024

Time (UTC)

10:59

Country

US

Event

Q1 2024 Intuitive Surgical Inc Earnings Release

Forecast

-

Previous

-
Friday, April 26, 2024

Time (UTC)

22:00

Country

US

Event

Intuitive Surgical Inc Annual Shareholders Meeting

Forecast

-

Previous

-
View all events
  • Annual
  • Quarterly
2022 2021 2020 2019 2018
Total revenue 6222.2 5710.1 4358.4 4478.5 3724.2
Revenue 6222.2 5710.1 4358.4 4478.5 3724.2
Cost of Revenue, Total 2026.2 1751.6 1497.2 1368.3 1120.1
Gross Profit 4196 3958.5 2861.2 3110.2 2604.1
Total Operating Expense 4645.1 3889.1 3308.6 3104 2524.8
Selling/General/Admin. Expenses, Total 1734 1459.2 1216.3 1177.6 941.4
Research & Development 858.7 659.9 579.3 557.3 418.1
Unusual Expense (Income) 20.3 11.1 15.8 0.8 45.2
Operating Income 1577.1 1821 1049.8 1374.5 1199.4
Interest Income (Expense), Net Non-Operating 29.7 69.3 157.2 127.7 80.1
Net Income Before Taxes 1606.8 1890.3 1207 1502.2 1279.5
Net Income After Taxes 1344.4 1728.1 1066.8 1381.8 1125.5
Minority Interest -22.1 -23.5 -6.2 -2.5 2.9
Net Income Before Extra. Items 1322.3 1704.6 1060.6 1379.3 1128.4
Net Income 1322.3 1704.6 1060.6 1379.3 1127.9
Income Available to Common Excl. Extra. Items 1322.3 1704.6 1060.6 1379.3 1128.4
Income Available to Common Incl. Extra. Items 1322.3 1704.6 1060.6 1379.3 1127.9
Diluted Net Income 1322.3 1704.6 1060.6 1379.3 1127.9
Diluted Weighted Average Shares 362 365.8 360.904 358.504 356.404
Diluted EPS Excluding Extraordinary Items 3.65276 4.65992 2.93873 3.84738 3.16607
Dividends per Share - Common Stock Primary Issue
Diluted Normalized EPS 3.69968 4.68766 2.97449 3.84943 3.27763
Total Extraordinary Items -0.5
Depreciation / Amortization 5.9 7.3
Sep 2023 Jun 2023 Mar 2023 Dec 2022 Sep 2022
Total revenue 1743.7 1755.9 1696.2 1655 1557.4
Revenue 1743.7 1755.9 1696.2 1655 1557.4
Cost of Revenue, Total 576.5 584 583.2 544.1 505.3
Gross Profit 1167.2 1171.9 1113 1110.9 1052.1
Total Operating Expense 1277.9 1292.7 1308.6 1282.5 1158.5
Selling/General/Admin. Expenses, Total 451.2 463.5 479.6 493 434.7
Research & Development 241.3 242.2 244.2 235.7 216.2
Depreciation / Amortization 0.8 0.8 0.9 1.3 1.4
Unusual Expense (Income) 8.1 2.2 0.7 8.4 0.9
Operating Income 465.8 463.2 387.6 372.5 398.9
Interest Income (Expense), Net Non-Operating 56.2 36 34.2 22.2 3.9
Net Income Before Taxes 522 499.2 421.8 394.7 402.8
Net Income After Taxes 419.8 426 360.8 336.7 324.7
Minority Interest -4.1 -5.2 -5.5 -11.8 -0.7
Net Income Before Extra. Items 415.7 420.8 355.3 324.9 324
Net Income 415.7 420.8 355.3 324.9 324
Income Available to Common Excl. Extra. Items 415.7 420.8 355.3 324.9 324
Income Available to Common Incl. Extra. Items 415.7 420.8 355.3 324.9 324
Diluted Net Income 415.7 420.8 355.3 324.9 324
Diluted Weighted Average Shares 358.2 357.3 356 356.9 360.5
Diluted EPS Excluding Extraordinary Items 1.16052 1.17772 0.99803 0.91034 0.89875
Dividends per Share - Common Stock Primary Issue 0 0 0 0
Diluted Normalized EPS 1.17871 1.18298 0.99972 0.93042 0.90076
  • Annual
  • Quarterly
2022 2021 2020 2019 2018
Total Current Assets 6253 5844.9 6625.9 4662.6 4333.2
Cash and Short Term Investments 4253.4 4341.2 5252.6 3221.7 3063.1
Cash & Equivalents 1084 718.6 978.3 754.5 588.5
Short Term Investments 2672.2 3050.3 3630 2054.1 2205.2
Total Receivables, Net 942.1 782.7 645.5 645.2 682.3
Accounts Receivable - Trade, Net 942.1 782.7 645.5 645.2 682.3
Total Inventory 893.2 587.1 601.5 595.5 409
Prepaid Expenses 144.8 116 108.3 196.7 178.8
Total Assets 12974 13555 11168.9 9733.2 7846.7
Property/Plant/Equipment, Total - Net 2456.4 1950.8 1641.2 1347.3 812
Property/Plant/Equipment, Total - Gross 3694.3 2919.4 2398.9 1910.4 1248.2
Accumulated Depreciation, Total -1237.9 -968.6 -757.7 -563.1 -436.2
Goodwill, Net 348.5 343.6 336.7 307.2 240.6
Intangibles, Net 49.8 70.5 77.4 112.1 66.7
Long Term Investments 2623.6 4415.5 1757.7 2623.5 1771.3
Other Long Term Assets, Total 1242.7 929.7 730 680.5 622.9
Total Current Liabilities 1422.1 1149.8 965.2 1030.2 820.6
Accounts Payable 147 121.2 81.6 123.5 100.7
Accrued Expenses 781.7 597.3 486.1 529.8 386.5
Notes Payable/Short Term Debt 0 0 0 0 0
Other Current Liabilities, Total 493.4 431.3 397.5 376.9 333.4
Total Liabilities 1932.1 1653.9 1437.4 1469.4 1167.9
Total Long Term Debt 0 0 0 0 0
Other Liabilities, Total 439.3 453.7 444.6 418.3 338.6
Total Equity 11041.9 11901.1 9731.5 8263.8 6678.8
Preferred Stock - Non Redeemable, Net 0 0 0 0
Common Stock 0.4 0.4 0.1 0.1 0.1
Additional Paid-In Capital 7703.9 7164 6445.2 5756.8 5170.3
Retained Earnings (Accumulated Deficit) 3500.1 4760.9 3261.3 2494.5 1521.7
Unrealized Gain (Loss) -6.6 -7.9 4.7 20.4 -9.8
Other Equity, Total -155.9 -16.3 20.2 -8 -3.5
Total Liabilities & Shareholders’ Equity 12974 13555 11168.9 9733.2 7846.7
Total Common Shares Outstanding 350 357.7 353.104 348.003 343.503
Cash 497.2 572.3 644.3 413.1 269.4
Minority Interest 70.7 50.4 27.6 20.9 8.7
Other Current Assets, Total 19.5 17.9 18 3.5
Sep 2023 Jun 2023 Mar 2023 Dec 2022 Sep 2022
Total Current Assets 8902.9 8031.8 6877 6253 6293.1
Cash and Short Term Investments 6610.1 5933.8 4824.3 4253.4 4440.5
Cash 474.3 520.3 605.2 497.2 536.3
Cash & Equivalents 3127.7 2915.1 1537.8 1084 1001.7
Short Term Investments 3008.1 2498.4 2681.3 2672.2 2902.5
Total Receivables, Net 962.7 904.2 925.3 942.1 849.6
Accounts Receivable - Trade, Net 962.7 904.2 925.3 942.1 849.6
Total Inventory 1147.5 1005.2 946.6 893.2 837.1
Prepaid Expenses 182.6 188.6 180.8 164.3 165.9
Total Assets 14712.7 13903.3 13053.2 12974 13260.8
Property/Plant/Equipment, Total - Net 3077 2830.8 2580.2 2456.4 2243.7
Goodwill, Net 348.1 348.6 348.6 348.5 348.2
Intangibles, Net 41.8 47.2 44.8 49.8 57.1
Long Term Investments 1044.9 1332.5 1886.4 2623.6 3078.1
Other Long Term Assets, Total 1298 1312.4 1316.2 1242.7 1240.6
Total Current Liabilities 1676.4 1538.4 1307.4 1422.1 1233.4
Accounts Payable 196.2 199.7 164.1 147 164.2
Accrued Expenses 742.6 703.3 600.1 781.7 639.1
Notes Payable/Short Term Debt 0 0 0 0 0
Other Current Liabilities, Total 737.6 635.4 543.2 493.4 430.1
Total Liabilities 2173.7 2024.2 1835.5 1932.1 1745.4
Total Long Term Debt 0 0 0 0 0
Minority Interest 84.5 80.6 76.5 70.7 58.6
Other Liabilities, Total 412.8 405.2 451.6 439.3 453.4
Total Equity 12539 11879.1 11217.7 11041.9 11515.4
Preferred Stock - Non Redeemable, Net 0 0 0 0 0
Common Stock 0.4 0.4 0.4 0.4 0.4
Additional Paid-In Capital 8385.9 8150.8 7928.4 7703.9 7684.8
Retained Earnings (Accumulated Deficit) 4209.2 3807.7 3397.4 3500.1 4017.8
Unrealized Gain (Loss) 10.3 -103.5 -116.6 -6.6 -177.4
Other Equity, Total -66.8 23.7 8.1 -155.9 -10.2
Total Liabilities & Shareholders’ Equity 14712.7 13903.3 13053.2 12974 13260.8
Total Common Shares Outstanding 352 351.3 350.4 350 353.3
Property/Plant/Equipment, Total - Gross 4545.2
Accumulated Depreciation, Total -1468.2
  • Annual
  • Quarterly
2022 2021 2020 2019 2018
Net income/Starting Line 1344.4 1728.1 1066.8 1381.8 1125
Cash From Operating Activities 1490.8 2089.4 1484.8 1598.2 1169.6
Cash From Operating Activities 338 282.8 226.4 160 108.6
Amortization 54.4 49.4 66.9 56.1 24.8
Deferred Taxes -185.3 -62.6 57.6 -8 31.9
Non-Cash Items 558.4 459.8 340.3 329.8 263
Cash Taxes Paid 444.2 180 34.4 158.6 179.2
Changes in Working Capital -619.1 -368.1 -273.2 -321.5 -383.7
Cash From Investing Activities 1370.8 -2461.5 -940.6 -1154.4 -1049.6
Capital Expenditures -532.4 -353.5 -341.5 -425.6 -187.4
Other Investing Cash Flow Items, Total 1903.2 -2108 -599.1 -728.8 -862.2
Cash From Financing Activities -2572.3 43 -85.7 -168.4 126.3
Financing Cash Flow Items -198.7 -233.5 -260.2 -171.7 -110.3
Issuance (Retirement) of Stock, Net -2373.6 276.5 174.5 3.3 236.6
Foreign Exchange Effects 5.4 -3.4 -2.6 -2.2 -0.1
Net Change in Cash 294.7 -332.5 455.9 273.2 246.2
Mar 2023 Dec 2022 Sep 2022 Jun 2022 Mar 2022
Net income/Starting Line 360.8 1344.4 1007.7 683 369.4
Cash From Operating Activities 371.4 1490.8 1052.9 669.7 223
Cash From Operating Activities 87.7 338 239.4 157.5 77.7
Amortization 12.4 54.4 40.9 25.9 12.7
Deferred Taxes 9.3 -185.3 -102 -40.1 -14.4
Non-Cash Items 144.7 558.4 425.2 277.5 143
Changes in Working Capital -243.5 -619.1 -558.3 -434.1 -365.4
Cash From Investing Activities 573.1 1370.8 796 251.5 -214.7
Capital Expenditures -194.1 -532.4 -394.7 -225.6 -95.1
Other Investing Cash Flow Items, Total 767.2 1903.2 1190.7 477.1 -119.6
Cash From Financing Activities -381.2 -2572.3 -1608.8 -682 -199.9
Financing Cash Flow Items -131.4 -198.7 -190.8 -182 -173.4
Issuance (Retirement) of Stock, Net -249.8 -2373.6 -1418 -500 -26.5
Foreign Exchange Effects 1.8 5.4 7.9 6 3.8
Net Change in Cash 565.1 294.7 248 245.2 -187.8
Investor Name Investor Type Percent Outstanding Shares Held Shares change Holdings Date Turnover Rating
The Vanguard Group, Inc. Investment Advisor/Hedge Fund 8.3842 29518477 156170 2023-06-30 LOW
T. Rowe Price Associates, Inc. Investment Advisor 5.2672 18544358 -1399906 2023-06-30 LOW
BlackRock Institutional Trust Company, N.A. Investment Advisor 4.818 16962733 599763 2023-06-30 LOW
State Street Global Advisors (US) Investment Advisor/Hedge Fund 4.2067 14810625 274201 2023-06-30 LOW
Fidelity Management & Research Company LLC Investment Advisor 2.2672 7982242 667250 2023-06-30 LOW
Capital World Investors Investment Advisor 2.1333 7510586 39671 2023-06-30 LOW
AllianceBernstein L.P. Investment Advisor/Hedge Fund 1.9763 6957880 -46991 2023-06-30 LOW
Geode Capital Management, L.L.C. Investment Advisor/Hedge Fund 1.8782 6612636 167641 2023-06-30 LOW
Invesco Capital Management (QQQ Trust) Investment Advisor 1.7002 5985880 47551 2023-09-30 LOW
JP Morgan Asset Management Investment Advisor 1.6089 5664468 1002535 2023-06-30 LOW
Edgewood Management LLC Investment Advisor/Hedge Fund 1.3911 4897684 -1167916 2023-06-30 LOW
Fisher Investments Investment Advisor/Hedge Fund 1.2623 4444151 55720 2023-06-30 LOW
Jennison Associates LLC Investment Advisor/Hedge Fund 1.2243 4310498 -145727 2023-06-30 LOW
Baillie Gifford & Co. Investment Advisor 1.1703 4120421 -58814 2023-06-30 LOW
Norges Bank Investment Management (NBIM) Sovereign Wealth Fund 0.9798 3449633 399513 2022-12-31 LOW
BlackRock Investment Management (UK) Ltd. Investment Advisor/Hedge Fund 0.917 3228512 39269 2023-06-30 LOW
Nuveen LLC Pension Fund 0.9104 3205086 -331379 2023-06-30 LOW
Walter Scott & Partners Ltd. Investment Advisor/Hedge Fund 0.8786 3093348 -72651 2023-09-30 LOW
BlackRock Financial Management, Inc. Investment Advisor/Hedge Fund 0.8465 2980361 81086 2023-06-30 LOW
BlackRock Asset Management Ireland Limited Investment Advisor 0.7489 2636528 68160 2023-06-30 LOW

Trading calculator

Calculate your hypothetical P&L if you had opened a CFD trade on a certain date (select a date) and closed on a different date (select a date).

Trade commission
0
  • 1:1
Leverage
1:1
  • 20
  • 100
  • 500
  • 1000
  • 10000
Investment
Trade size (Leverage x Investement):
Open

Close

Short Long

For the avoidance of doubt, this calculation does not include the costs of holding a position overnight (for which there will be additional charges)

Intuitive Company profile

Intuitive Surgical, Inc. (ISRG) is a developer of minimally invasive, robot-assisted surgery. The company develops, manufactures and markets the da Vinci surgical system.

Established in 1995, Intuitive is headquartered in California and operates across the US, Western Europe, and the Asia Pacific regions. It also operates in China through Intuitive Fosun, a joint venture with Fosun Pharma.

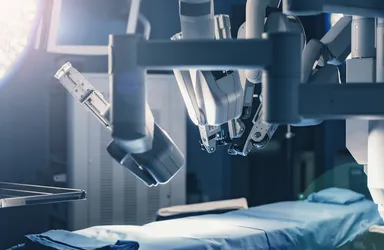
The da Vinci Surgical System helps physicians and healthcare providers conduct complex surgery with the help of robots. The process reduces variability in surgery, and helps deliver better care and early recovery.

Intuitive also designed and developed Ion, a robot-assisted endoluminal platform. Ion is designed to perform peripheral lung biopsies with the help of an advanced ultra-thin, ultra-manoeuvrable catheter that allows navigation far into the peripheral lung. The technology is precise and gives unprecedented stability. 

Along with the launch of the da Vinci surgical system, Intuitive Surgical went public in 2000, trading on the Nasdaq stock exchange under the ticker symbol ISRG.

Check out ISRG’s price history and today’s quote, and follow the ups and downs of the share value at Capital.com. Stay on top of the latest price developments with our live ISRG stock chart.

Industry: Advanced Medical Equipment & Technology (NEC)

1020 Kifer Road
SUNNYVALE
CALIFORNIA 94086
US

Income Statement

  • Annual
  • Quarterly

News

December RBA preview: no move expected at the final meeting of 2023

The RBA meets on Tuesday, 5th of December, 2023, at 2.30 PM (AEDT). We preview what to expect from this month’s decision.

14:47, 4 December 2023

CPI drops more than expected in Europe, Spain’s IBEX 35 looking to break pre-COVID highs

CPI drops more than expected in Europe, Spain’s IBEX 35 looking to break pre-COVID highs

12:39, 30 November 2023

Euro Zone CPI expected to continue dropping; economists warn about cutting too soon

EZ PI expected to drop further but speed of decline

08:16, 29 November 2023

A weaker Dollar drives gold higher

Gold prices have returned above $US2000 per ounce. We run through the factors driving gold and the commodity’s key technicals.

13:49, 28 November 2023

Q3 US Earnings Recap: Profits surprise to the upside, but outlook remains uncertain

US earnings for the third quarter were far better than expected. However, uncertainty about the outlook for company profits continues. We review the quarterly earnings and look ahead to what the markets expect from S&P 500 companies going forward.

13:20, 28 November 2023

RBNZ Preview: Rates expected to remain unchanged at final meeting of 2023

The RBNZ meets for the final time this year on Wednesday, 29th of November, 2023. We preview what to expect and how it could impact the New Zealand Dollar.

13:04, 28 November 2023

Crude prices slide on OPEC+ uncertainty

Crude prices have chopped sideways amid signs of turmoil within OPEC+. We look at the fundamentals of the oil market and the technical levels of WTI.

12:55, 28 November 2023

People also watch

XRP/USD

0.64 Price
-0.260% 1D Chg, %
Long position overnight fee -0.0753%
Short position overnight fee 0.0069%
Overnight fee time 22:00 (UTC)
Spread 0.01168

Oil - Crude

70.08 Price
+0.910% 1D Chg, %
Long position overnight fee -0.0205%
Short position overnight fee -0.0014%
Overnight fee time 22:00 (UTC)
Spread 0.030

Gold

2,032.77 Price
+0.320% 1D Chg, %
Long position overnight fee -0.0196%
Short position overnight fee 0.0114%
Overnight fee time 22:00 (UTC)
Spread 0.30

US100

15,829.20 Price
+0.250% 1D Chg, %
Long position overnight fee -0.0263%
Short position overnight fee 0.0041%
Overnight fee time 22:00 (UTC)
Spread 1.8

Still looking for a broker you can trust?

Join the 570.000+ traders worldwide that chose to trade with Capital.com

1. Create & verify your account 2. Make your first deposit 3. You’re all set. Start trading