Thyssenkrupp stock forecast: Third-party price targets
Thyssenkrupp is a German industrial group listed in Frankfurt, with business activities covering steel production, industrial services and defence-related operations across multiple markets. Explore third-party TKA price targets and technical analysis.
Thyssenkrupp AG (TKA) is trading around €10.92 on Capital.com’s feed as of 10:06am UTC on 2 February 2026, after moving between an intraday low of €10.81 and a high of €11.41 in the current session. Past performance is not a reliable indicator of future results.
The move comes in the wake of Thyssenkrupp’s recent annual general meeting, where shareholders approved all agenda items and the group highlighted progress on its restructuring plans and the separate stock market listing of its TKMS defence unit, which is currently trading above its issue price. The stock is also trading against a backdrop of a softer start to February for the broader German equity market, with indications of a weaker DAX open amid lingering risk aversion (Investing.com, 30 January 2026).
Thyssenkrupp stock forecast 2026–2030: Third-party price targets
As of 2 February 2026, third-party Thyssenkrupp stock predictions span a range around the current spot level, reflecting differing views on the group’s exposure to European steel pricing, restructuring progress and wider macroeconomic conditions. The following summaries focus on broker and data-vendor targets.
J.P. Morgan (investment bank)
J.P. Morgan raised its TKA stock forecast to €11.10 from €7.60, while maintaining a neutral rating. The broker cited stronger performance across European steel equities amid expectations of higher EU steel prices and noted that earnings may have moved past a trough. It continues to differentiate between stainless and carbon steel producers within its sector view (MarketScreener, 29 January 2026).
Deutsche Bank (broker research on related unit)
Deutsche Bank kept an €11 target price and a buy rating on Thyssenkrupp Nucera as of 23 January 2026, pointing to continued execution and a return to positive EBIT despite softer sales. The bank linked its assessment to expectations for project activity and margin development in electrolyser and hydrogen-related equipment, set against what it describes as a trough phase in demand (MarketScreener, 23 January 2026).
Simply Wall St (valuation-focused model)
Simply Wall St’s coverage of Thyssenkrupp shows a consensus target of around €11.41. The platform frames these estimates within the context of steel-sector cyclicality, restructuring execution risks and modelled sensitivity to European industrial activity (2 February 2026).
Predictions and third-party forecasts are inherently uncertain, as they cannot fully account for unexpected market developments. Past performance is not a reliable indicator of future results.
TKA stock price: Technical overview
The TKA stock price is trading around €10.92 as of 10:06am UTC on 2 February 2026, holding just above the classic pivot at €10.78 and below the immediate resistance marked by R1 at €12.13. The 20-, 50-, 100- and 200-day simple moving averages cluster around €10.62, €9.75, €9.15 and €7.79 respectively, keeping a 20-over-50 alignment intact and indicating a medium-term upward bias while the price remains above the longer-term base.
On momentum, the 14-day RSI near 58 sits in the upper-neutral range, while an ADX reading around 25 suggests an established but not overextended trend. A daily close above the R1 area would bring the €12.98 R2 zone into view as the next upside reference. On pullbacks, the €10.78 pivot and then the 100-day SMA near €9.15 act as successive support levels, with a break below that area potentially opening the way toward the €9.93–€9.94 S1 region (TradingView, 2 February 2026).
This technical analysis is provided for informational purposes only and does not constitute financial advice or a recommendation to buy or sell any instrument.
Thyssenkrupp share price history (2024–2026)
TKA’s stock price spent much of early 2024 consolidating just below the €5 level, having traded around €3.90–€4.20 for most of late 2023 and into January 2024. From February 2024, the stock moved higher into the mid-€5s at times, before easing back towards €4.50–€4.80 into late spring. It then gradually worked higher again through the summer months of 2024.
Momentum strengthened in 2025. From levels near €4.85 at the end of January 2025, TKA more than doubled over the following 12 months, rising through €8 by June and accelerating above €10 into July, before reaching the €12.59–€13.23 area in mid-October. After that move, the price cooled, retracing towards €8.90–€9.30 by December 2025, before rebounding at the start of 2026. By 30 January 2026, the stock had closed at €11.37, leaving it significantly higher year on year compared with late January 2025.
Past performance is not a reliable indicator of future results. Share prices are indicative and may differ from live market prices.
Thyssenkrupp (TKA): Capital.com analyst view
Thyssenkrupp’s share price over the past two years reflects a cyclical recovery profile, moving from low single-digit levels in early 2024 to trade within a higher €8–€12 range through much of 2025 and into early 2026. This period has coincided with the group advancing its portfolio reshaping and the separate listing of its TKMS defence business, which has helped draw clearer distinctions between different parts of the wider group. At the same time, the stock has experienced pronounced swings around restructuring updates and broader moves in European steel and industrial equities.
From here, market participants following Thyssenkrupp often weigh two opposing forces. On one side, management’s efforts to cut steel capacity, reduce costs and simplify the portfolio could support profitability and sentiment if delivered as outlined. On the other, the restructuring programme carries execution risk, including job reductions and the prospect of a forecast net loss in 2025/26, which could weigh on the share price if steel demand or pricing falls short of expectations. Supportive industry developments, such as EU measures aimed at domestic steelmakers or a stabilisation in European steel consumption, may provide a tailwind, while a weaker macroeconomic backdrop, persistent overcapacity or setbacks in the steel or TKMS divisions could reintroduce pressure and volatility.
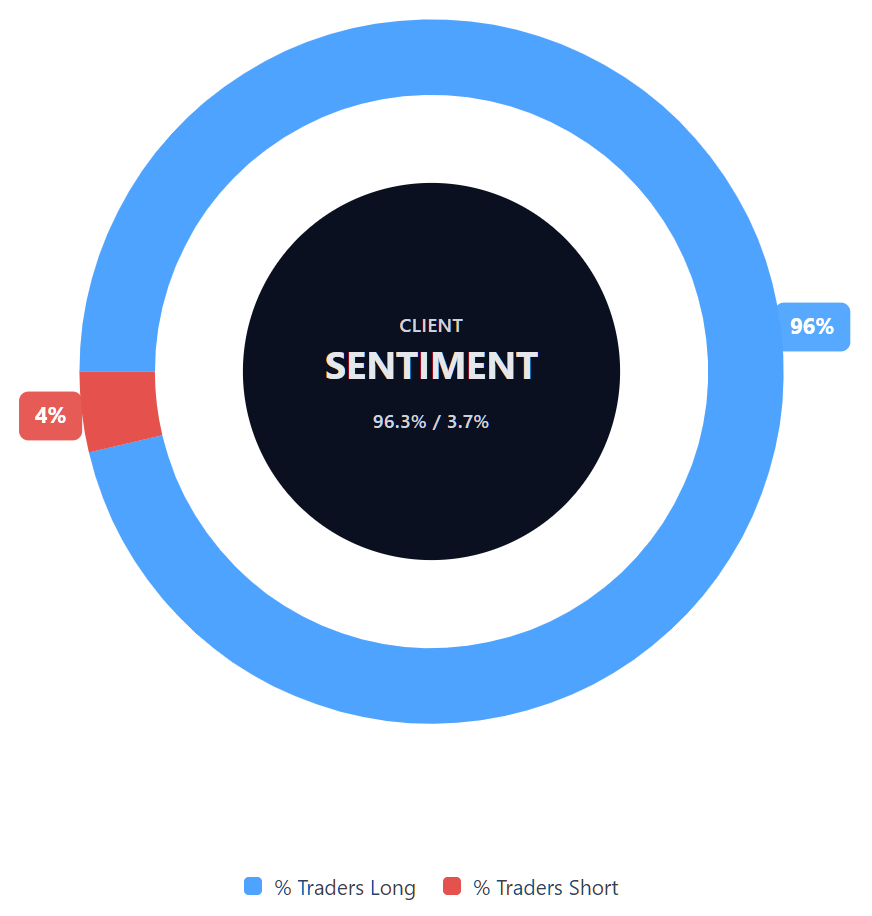
Capital.com’s client sentiment for Thyssenkrupp CFDs
As of 2 February 2026, Capital.com client positioning in Thyssenkrupp CFDs shows 96.3% buyers versus 3.7% sellers, representing a heavily skewed long stance and leaving buyers ahead by approximately 92.7 percentage points. This snapshot reflects open positions on Capital.com and may change over time as positions are opened or closed.
Summary – Thyssenkrupp 2026
- Thyssenkrupp’s share price rose from around €4.85 in late January 2025 to above €10 by mid-year, before moving into the €12.60–€13.20 area in October and later retracing towards €9–€9.30 by December.
- Technical indicators show the price holding above a rising 20-, 50-, 100- and 200-day moving-average cluster, with the 14-day RSI in upper-neutral territory and the ADX pointing to an established, though not extreme, trend.
- Recent price movements have been shaped by ongoing restructuring within the steel division, including capacity reductions and job cuts, alongside portfolio changes and the separate listing of the TKMS defence unit.
- External factors, including EU steel-market measures and shifting expectations for European industrial demand, have acted as both support and headwinds for the stock at different stages.
Past performance is not a reliable indicator of future results.
FAQ
Who owns the most Thyssenkrupp stock?
Thyssenkrupp has a diversified shareholder base, with ownership spread across institutional investors, strategic shareholders and retail investors. Large asset managers and pension funds typically feature among the largest holders, reflecting the company’s inclusion in European equity indices. No single shareholder is generally viewed as having outright control, meaning decision-making remains influenced by a broad mix of investor interests and governance structures rather than one dominant owner.
What is the five-year Thyssenkrupp share price forecast?
There is no single, agreed five-year TKA stock forecast. Long-term projections vary widely and depend on assumptions around European steel demand, pricing cycles, restructuring outcomes and broader economic conditions. Analyst targets tend to focus on shorter horizons, such as 12 months, while longer-term views are more scenario-based. As a cyclical industrial stock, Thyssenkrupp’s longer-term price path may remain sensitive to shifts in economic and sector conditions.
Is Thyssenkrupp a good stock to buy?
Whether Thyssenkrupp is a suitable stock depends on an individual’s objectives, risk tolerance and time horizon. The company provides exposure to cyclical industries such as steel, industrial services and defence, alongside ongoing restructuring efforts. These elements may create potential opportunities but also introduce uncertainty and volatility. This content is for informational purposes only and does not constitute financial advice or a recommendation to buy or sell any security.
Could Thyssenkrupp stock go up or down?
Like all publicly traded shares, Thyssenkrupp’s stock price can move both up and down. Price changes may be driven by company-specific developments, such as restructuring progress or earnings results, as well as external factors including steel prices, European economic data and broader market sentiment. As a cyclical stock, it may experience sharper swings during periods of economic change, meaning movements are not always linear or predictable.
Should I invest in Thyssenkrupp stock?
Deciding whether to invest in Thyssenkrupp requires careful consideration of personal financial circumstances, investment objectives and risk appetite. Investing in individual shares involves the risk of capital loss, particularly for companies exposed to cyclical industries and restructuring processes. Some investors choose to assess a range of scenarios, including both potential upside and downside risks, before committing capital. This article does not provide investment advice or personalised recommendations.
Can I trade Thyssenkrupp CFDs on Capital.com?
Yes, you can trade Thyssenkrupp CFDs on Capital.com. Trading share CFDs lets you speculate on price movements without owning the underlying asset and to take long or short positions. However, contracts for difference (CFDs) are traded on margin, and leverage amplifies both profits and losses. You should ensure you understand how CFD trading works, assess your risk tolerance, and recognise that losses can occur quickly.