SAP stock forecast: Third-party price targets
SAP is a Germany-listed enterprise software company providing business applications and cloud services to organisations worldwide, with its shares traded across multiple European and international markets. Explore third-party SAP price targets and technical analysis.
SAP SE (SAP) is trading around €168.50 in intraday European dealing at 4:10pm (UTC) on 5 February 2026, within a session range of approximately €160.05–€173.50 and broadly in line with recent moves in wider European equities. Past performance is not a reliable indicator of future results.
The move comes amid continued focus on SAP’s recently reported Q4 and full-year 2025 results, in which the company highlighted double-digit total revenue growth and a strong expansion in cloud backlog, underlining an ongoing shift toward cloud and software-as-a-service contracts (SAP, 29 January 2026). This price action has also tracked broader Euro Area equity trading, where the Euro Stoxx 50 index was little changed on 5 February 2026, and SAP shares on the cash market were reported up around 3% on the day, contributing to large-cap technology and industrials performance across the region (Trading Economics, 5 February 2026).
SAP stock forecast 2026–2030: Third-party price targets
As of 5 February 2026, third-party SAP stock predictions summarise six third-party one-year target markers and the assumptions cited by each source.
J.P. Morgan (target cut after earnings)
J.P. Morgan lowered its SAP stock forecast from €290 to €260 on 30 January 2026, while maintaining an Overweight rating. The broker cites softer-than-expected growth in SAP’s current cloud backlog and a general weakening in software-sector sentiment as reasons for adjusting valuation multiples after the Q4 2025 release (MarketScreener, 30 January 2026).
Berenberg (revised downside and valuation)
Finimize notes that Berenberg cut its SAP target from €280 to €250, retaining a Buy recommendation. The bank explains the reduction by pointing to a lower valuation multiple amid weaker market sentiment and trimmed revenue projections, after the stock fell sharply on the Xetra market in late January (Finimize, 2 February 2026).
Fintel (Milan listing)
Fintel reports that the average one-year target for SAP was revised to about €257.25 per share. According to the service, this average reflects a range of individual analyst targets between roughly €151 and €335, with the downgrade occurring as analysts reassessed expectations following January’s guidance and the subsequent share-price reaction (Nasdaq, 4 February 2026).
Predictions and third-party forecasts are inherently uncertain, as they cannot fully account for unexpected market developments. Past performance is not a reliable indicator of future results.
SAP stock price: Technical overview
The SAP stock price is trading around €168.50 as of 4:10pm (UTC) on 5 February 2026, well below its near-term moving-average cluster, with the 20-, 50-, 100- and 200-day moving averages located near €191, €201, €213 and €233 respectively. The 14-day RSI, at approximately 31.8, sits in lower-neutral territory rather than clearly oversold, while an ADX reading near 28.2 points to an established trend backdrop rather than a range-bound market.
On the upside, the nearest classic pivot resistance is located around €205.93, with €241.31 representing a higher reference level if a daily close above that initial barrier were to develop. On the downside, the classic pivot at approximately €184.03 is the first area to watch on rebounds, while the 100-day SMA near €213 marks a higher moving-average reference. Further below, S1 near €148.65 defines a deeper support area if price were to move decisively below the central pivot zone (TradingView, 5 February 2026).
This technical analysis is provided for informational purposes only and does not constitute financial advice or a recommendation to trade.
SAP share price history (2024–2026)
SAP’s stock price spent much of 2024 trading within a relatively stable range between roughly €170 and €240, closing at €168 on 7 February 2024 before gradually advancing through the summer and autumn. The shares reached levels above €230 by October and continued to hold in the low- to mid-€200s into late 2024, ending the year near €236–€241, before pushing toward the €270 area in early 2025.
From that point, price behaviour became more mixed. After trading mostly between €245 and €275 through mid-2025, SAP began to trend lower in the second half of the year, easing from the €260–€270 zone in June and July to around €210–€230 by November. The decline extended into December, with prices approaching €210, before accelerating into early 2026. The share closed at €202 on 2 January 2026 and fell sharply following late-January volatility, finishing at €168.95 on 5 February 2026, placing it back near levels last seen around a year earlier.
Past performance is not a reliable indicator of future results. Share prices are indicative and may differ from live market prices.
SAP (SAP): Capital.com analyst view
SAP’s share price has come under sustained pressure into early February 2026, sliding from levels above €250 in early 2025 to around €168.50 as of 4:10pm (UTC) on 5 February 2026, as markets adjusted to a sharp reprice following the latest earnings update. Recent moves reflect a tension between reported fundamentals and investor sentiment. SAP’s Q4 and full-year 2025 statement showed that it met its revenue outlook and exceeded non-IFRS operating-profit and free-cash-flow guidance, with total cloud revenue and backlog continuing to grow at double-digit rates. At the same time, the share price weakened as attention shifted to a deceleration in key cloud backlog metrics relative to earlier expectations.
This backdrop presents a nuanced picture for traders monitoring SAP. On one hand, some commentators point to record free cash flow, continued cloud ERP adoption and SAP’s focus on AI-enabled applications as supportive factors for the longer-term equity case. On the other, several market reports highlight that a softer-than-anticipated cloud order pipeline, guidance sensitivity and the recent drawdown have raised questions around the pace at which this strategy may translate into sustained revenue and earnings momentum. While strong execution on backlog conversion, margins and cash generation could prove constructive over time, downside risks remain if growth slows further, competitive pressures intensify or broader equity-market conditions deteriorate.
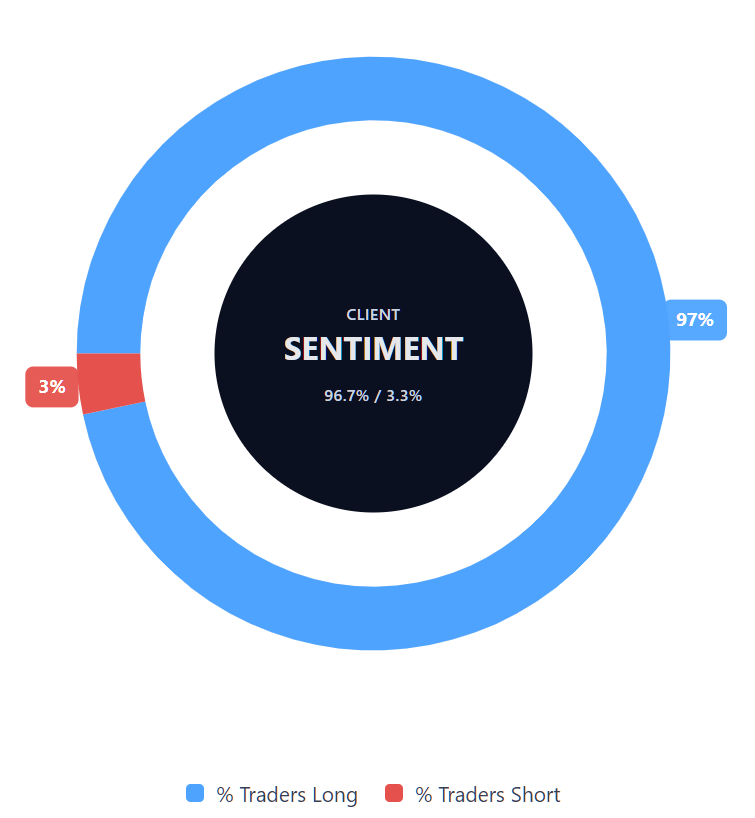
Capital.com’s client sentiment for SAP CFDs
As of 5 February 2026, Capital.com client positioning in SAP CFDs is strongly skewed, with buyers accounting for 96.7% of open positions versus 3.3% sellers, leaving a net long bias of 93.4 percentage points. This snapshot reflects current open positions on the platform and may change over time.
Summary – SAP 2026
- SAP spent much of 2025 trading between approximately €245 and €275 before turning lower in the second half of the year.
- By late 2025, the shares had slipped into the €210–€230 range, before falling more sharply in January 2026 amid earnings-related volatility.
- As of 5 February 2026, SAP trades around €168.50, well below its mid-2025 highs and close to levels seen roughly a year earlier.
- Technical indicators show the price below its 20-, 50-, 100- and 200-day moving averages, with RSI in lower-neutral territory and ADX pointing to an established trend environment.
- Recent Q4 and full-year 2025 results combined solid cloud and free-cash-flow metrics with market concerns around slower cloud backlog growth, contributing to the share-price repricing.
Past performance is not a reliable indicator of future results.
FAQ
Who owns the most SAP stock?
SAP has a widely distributed shareholder base, with ownership split between institutional investors, mutual funds and retail shareholders. Large global asset managers and pension funds typically feature among the largest institutional holders, reflecting SAP’s position as a major European large-cap technology company. SAP also has a history of employee share ownership and free-float trading across multiple listings, which contributes to broad market participation rather than concentrated control.
What is the five-year SAP share price forecast?
There is no single agreed five-year SAP stock forecast, as long-term projections depend on assumptions around cloud growth, margins, competitive dynamics and broader equity-market conditions. Most publicly available forecasts focus on 12-month horizons rather than multi-year targets. Over longer periods, SAP’s share price has historically moved through cycles shaped by earnings momentum, valuation changes and shifts in investor sentiment toward the software sector.
Is SAP a good stock to buy?
Whether SAP is considered attractive depends on an individual’s objectives, risk tolerance and time horizon. Some analysts highlight SAP’s scale, recurring cloud revenues and cash-flow generation as potential longer-term strengths, while others point to near-term uncertainty around cloud backlog growth and valuation resets. As with any listed equity, SAP’s shares can be volatile, and past performance does not indicate future results. This content is provided for informational purposes only and does not constitute investment advice.
Could SAP stock go up or down?
SAP’s share price can move both higher and lower, influenced by company-specific developments and broader market conditions. Earnings results, guidance updates, cloud revenue trends and changes in software-sector sentiment may all affect price movements. External factors such as interest rates, macroeconomic data and overall equity-market volatility can also play a role. Price fluctuations may be pronounced around earnings announcements or periods of heightened market uncertainty.
Should I invest in SAP stock?
Deciding whether to invest in SAP is a personal decision that depends on financial goals, experience and risk appetite. SAP offers exposure to the global enterprise software and cloud services market, but it also faces execution risks and competitive pressures. Equity investments involve the risk of capital loss, and share prices may not move as expected. You should assess your own circumstances and consider seeking independent advice before making any investment decisions.
Can I trade SAP CFDs on Capital.com?
Yes, you can trade SAP CFDs on Capital.com. Trading share CFDs lets you speculate on price movements without owning the underlying asset and to take long or short positions. However, contracts for difference (CFDs) are traded on margin, and leverage amplifies both profits and losses. You should ensure you understand how CFD trading works, assess your risk tolerance, and recognise that losses can occur quickly.