
Intesa Sanpaolo stock forecast | share capital and articles update
Intesa Sanpaolo is an Italian banking group listed on Borsa Italiana, with July 2026 updates to its share capital and Articles of Association in focus. Explore third-party ISP price targets and technical analysis. Past performance is not a reliable indicator of future results.
Intesa Sanpaolo S.p.A. (ISP) was quoted at €6.22, above the intraday range of €6.11–€6.24 recorded during the session at 1:48pm UTC on 6 July 2026. Past performance is not a reliable indicator of future results.
The move followed a series of corporate disclosures. Intesa Sanpaolo confirmed a change in its share capital on 1 July 2026 after the issuance of 203,037,336 new ordinary shares (Intesa Sanpaolo Group, 1 July 2026), and separately filed a notice on 3 July 2026 regarding amendments to its Articles of Association (Intesa Sanpaolo Group, 3 July 2026). The bank's shares also remain in focus amid broader scrutiny of the Italian banking sector, after the European Central Bank flagged concerns that measures in Italy's 2026 budget could affect bank liquidity by prompting lenders to reduce interest paid on deposits (Reuters, 15 December 2025).
Third-party ISP outlook: MP5 offer and July filings
As of 6 July 2026, third-party Intesa Sanpaolo stock predictions show a generally positive stance, shaped by the group's unsolicited bid for Monte dei Paschi and its ongoing capital return programme. The following mini-briefs summarise consensus data and third-party forecasts published within this window, ranked from lower to higher target.
MarketScreener (analyst consensus)
MarketScreener's panel of 21 analysts carries a mean Buy consensus for Intesa Sanpaolo, with an average 12-month target price of €6.73. Estimates range from €5 to €7.40, against a last close of €5.60. The spread illustrates divergent assumptions on net interest income trends as the group scales its retail and wealth management franchise (MarketScreener, 21 May 2026).
Investing.com (consensus overview)
Investing.com aggregates 16 analyst forecasts for ISP, returning an average 12-month price target of €6.84, a high estimate of €7.40 and a low estimate of €6. This implies a potential upside of 9.86% relative to a share price of €6.22. Twelve of the 16 contributors carry a Buy-equivalent rating, with the consensus little changed as the MPS tender offer process progresses (Investing.com, 5 July 2026).
TradingView (analyst price target aggregation)
TradingView's aggregation of analyst opinions shows a maximum estimate of €7.40 and a minimum estimate of €6 for Intesa Sanpaolo, based on ratings gathered as of 3 July 2026. The platform attributes the tight clustering of targets to steady capital return execution and limited near-term earnings revisions (TradingView, 3 July 2026).
Predictions and third-party forecasts are inherently uncertain, as they cannot fully account for unexpected market developments. Past performance is not a reliable indicator of future results.
Intesa Sanpaolo earnings: latest results and next report
Intesa Sanpaolo's Board of Directors is scheduled to meet on 29 July 2026 to approve the half-yearly report for the period ended 30 June 2026, marking the group's next scheduled earnings release (Intesa Sanpaolo Group, 31 January 2026). The report will cover the second quarter of 2026 and follows the bank's most recent published results, which related to the first quarter (MarketScreener, 7 May 2026).
The Q1 2026 interim statement, released on 8 May 2026, reported net income of €2.8 billion, described as the best quarterly result in the bank's history (Business Review, 14 May 2026). Reuters reported that Intesa's full-year 2025 profit reached €9 billion, while the group projected 2026 net income of approximately €10 billion under its 2026–2029 strategic plan, announced on 2 February 2026 (Reuters, 2 February 2026).
This information is provided for informational purposes and does not constitute investment advice. Past or simulated performance is not a reliable indicator of future results
ISP stock price: technical overview
As of 1:48pm UTC on 7 July 2026, the ISP stock price traded near €6.22, holding above its 20/50/100/200-DMAs at approximately €6 / €5.83 / €5.66 / €5.69, according to TradingView data. The 20-over-50 alignment remains intact, while the 14-day RSI sits near 65, placing momentum in an upper-neutral to firm range rather than at stretched extremes. The ADX(14) is near 17, below the 25 threshold often associated with an established trend, suggesting directional conviction remains moderate.
The nearest classic pivot reference above last price sits at R1 near €6.34, with R2 near €6.70 potentially coming into view after a daily close above that level, according to TradingView. On the downside, the classic pivot point near €5.88 marks the first support reference, while the 200-day SMA near €5.69 forms the closest longer-term shelf. A move below that area could increase the risk of a shift towards the S1 marker near €5.53 (TradingView, 6 July 2026).
This is technical analysis for informational purposes only and does not constitute financial advice or a recommendation to buy or sell any instrument.
Intesa Sanpaolo share price history (2024–2026)
ISP’s stock price climbed steadily over the past two years, having traded around €3.58 on 8 July 2024.
Momentum built through the second half of 2024, with the stock pushing past €4 by mid-December amid broader optimism around European banking sector consolidation [file]. Early 2025 brought volatility, with a sharp dip to €3.66 on 9 April 2025 coinciding with global market turbulence tied to tariff announcements, before the stock later recovered to €4.78.
The rally extended through the rest of 2025 and into 2026, with shares reaching €6.24 by mid-February 2026 [file]. A pullback followed, with the stock touching a low of €4.82 on 23 March 2026 during a period of heightened market uncertainty, before rebounding sharply.
By early June 2026, the stock traded near €5.59 amid Intesa’s unsolicited €30.6bn bid for Monte dei Paschi. It then climbed to close at €6.25 on 6 July 2026, roughly 74.5% up year on year.
Past performance is not a reliable indicator of future results. Share prices are indicative and may differ from live market prices.
Intesa Sanpaolo (ISP): Capital.com analyst view
Intesa Sanpaolo’s share price performance over the past two years has been marked by sustained gains, with the stock advancing from around €3.58 in July 2024 to above €6.24 by early July 2026. This move has coincided with record quarterly profitability, a structured capital return programme targeting a high proportion of annual profit, and the group’s unsolicited bid for Monte dei Paschi. Some market participants view the offer as a step towards greater scale and diversification across Italian and European banking. Others may see the tender process as adding integration risk, regulatory uncertainty, and potential dilution for existing shareholders if the deal proceeds on less favourable terms.
The rally has also occurred alongside a broader recovery in European bank valuations, supported by resilient net interest margins in a shifting rate environment. That backdrop could change if central bank policy shifts put further pressure on margins, or if Italian sovereign risk premiums widen, given the bank’s domestic exposure, although outcomes remain uncertain. Periods of sharp volatility, including notable pullbacks in April and March 2026, show that gains have not been linear and remain sensitive to macroeconomic and company-specific developments. Past performance is not a reliable indicator of future results.
Capital.com’s client sentiment for Intesa Sanpaolo CFDs
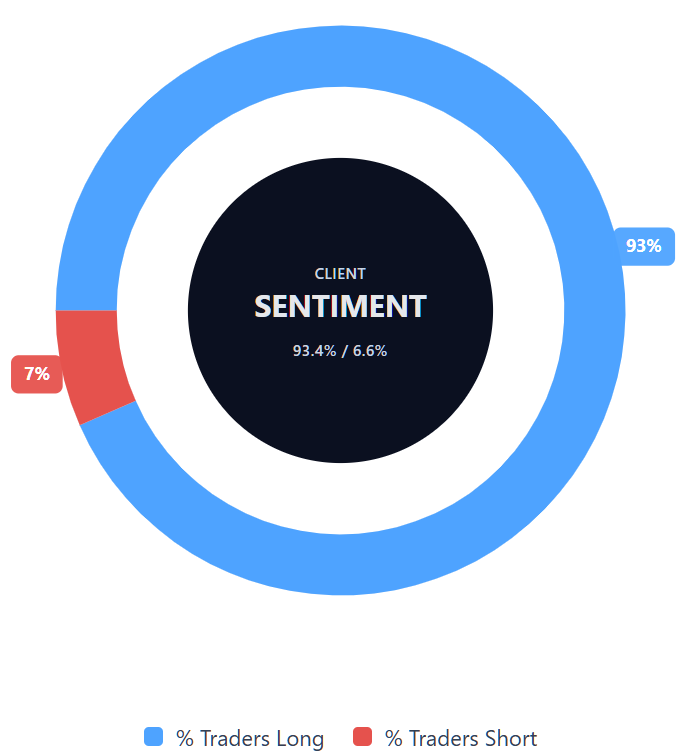
As of 6 July 2026, Capital.com client positioning in Intesa Sanpaolo CFDs shows 93.4% buyers versus 6.6% sellers, putting buyers ahead by 86.8 percentage points. This heavy buy-side skew means positioning is firmly weighted towards long exposure, beyond a typical majority-buy reading. The snapshot reflects open positions on Capital.com and can change. Client sentiment is not a reliable indicator of future price direction.
Summary – Intesa Sanpaolo 2026
- As of 1.48pm UTC on 6 July 2026, Intesa Sanpaolo was trading near €6.22, having risen from around €3.58 in July 2024.
- Technical indicators show ISP holding above its 20/50/100/200-DMAs, with RSI near 65 reflecting firm, non-extreme momentum.
- Key drivers include the pending Monte dei Paschi tender offer, record Q1 2026 profitability, and the group’s capital return programme.
- Recent attention includes the ECB-authorised €2.3bn share buyback launched on 6 July 2026 and upcoming half-year results due on 29 July 2026.
Past performance is not a reliable indicator of future results.
FAQ
Who owns the most Intesa Sanpaolo stock?
The article does not identify the largest shareholder of Intesa Sanpaolo. Ownership can change as institutions adjust holdings, corporate actions complete and new disclosures become available. For the latest breakdown, traders should refer to Intesa Sanpaolo’s shareholder filings, annual reports and exchange disclosures. In this article, the ownership question sits behind wider themes, including the Monte dei Paschi tender process, capital returns and recent share-price performance.
What is the five-year Intesa Sanpaolo share price forecast?
The article does not provide a five-year Intesa Sanpaolo share price forecast. It focuses on third-party 12-month analyst targets published between 10 June 2026 and 6 July 2026, which broadly converged around €6.30–€6.84 on average. Longer-term forecasts may vary more widely, as they depend on earnings, interest rates, regulation, capital returns, integration risks and wider conditions across the European banking sector.
Is Intesa Sanpaolo a good stock to buy?
Whether Intesa Sanpaolo is a good stock to buy depends on a trader’s objectives, risk tolerance and market view. The article notes supportive factors, including recent profitability, capital returns and the Monte dei Paschi bid. It also highlights risks, such as regulatory uncertainty, integration risk, potential margin pressure and Italian sovereign exposure. This information is not investment advice, and past performance is not a reliable indicator of future results.
Could Intesa Sanpaolo stock go up or down?
Intesa Sanpaolo stock could move in either direction. The article notes that third-party analyst targets were generally positive over the reviewed period, while technical indicators showed the stock trading above key moving averages. However, the same analysis also points to moderate trend conviction, previous pullbacks and sensitivity to macroeconomic, regulatory and company-specific developments. Forecasts can be inaccurate, especially when market conditions change unexpectedly.
Should I invest in Intesa Sanpaolo stock?
The article does not make a recommendation on whether to invest in Intesa Sanpaolo stock. Any decision would depend on personal financial circumstances, investment goals and appetite for risk. The article outlines factors that may influence the share price, including earnings, capital returns, the Monte dei Paschi offer, interest-rate expectations and Italian banking-sector risks. Traders should do their own research and consider seeking independent professional advice where appropriate.
Can I trade Intesa Sanpaolo CFDs on Capital.com?
Yes, you can trade Intesa Sanpaolo CFDs on Capital.com. Trading share CFDs lets you speculate on price movements without owning the underlying asset and to take long or short positions. However, contracts for difference (CFDs) are traded on margin, and leverage amplifies both profits and losses. You should ensure you understand how CFD trading works, assess your risk tolerance, and recognise that losses can occur quickly.