Amazon.com stock forecast: Third-party price targets
Amazon.com is a US-listed multinational technology company with operations spanning online retail, cloud computing and digital advertising, making its shares a widely followed component of major US equity indices. Explore third-party AMZN price targets and technical analysis.
Amazon.com, Inc. (AMZN) is trading around $205.45 at 9:20am on 12 February 2026, moving within an intraday range of $202.72–$208.83, as quoted on the Capital.com platform. Past performance is not a reliable indicator of future results.
Recent coverage of AWS revenue growth and multi-year capital expenditure plans has highlighted increased infrastructure investment to support AI workloads (Reuters, 5 February 2026). The broader US technology complex also remains in view, with the US 100 Tech Index trading higher in February 2026 and remaining up over the past month and year, providing a firmer backdrop for large-cap technology stocks (Trading Economics, 11 February 2026). Market participants are additionally monitoring upcoming US macroeconomic data releases, including delayed jobs and inflation figures, which have been cited as potential drivers of volatility for growth and technology shares (S&P Global, 6 February 2026, 5 February 2026).
Amazon.com stock forecast 2026–2030: Third-party price targets
As of 12 February 2026, third-party Amazon.com stock predictions indicate a cluster of 12-month views in the mid- to high-$280s, with outliers on both sides reflecting different assumptions about cloud growth, artificial intelligence capex and consumer demand. These figures represent indicative analyst objectives over the coming year rather than guaranteed outcomes and remain subject to change as forecasts are revised.
Forbes (Wall Street targets)
Forbes notes that, the average Amazon.com 12-month price target across Wall Street analysts stands at around $297, with some individual forecasts reaching approximately $360. The article states that these levels are framed around expectations for continued AWS and advertising growth, as well as margin expansion linked to cost efficiencies (Forbes, 2 January 2026).
24/7 Wall St. (analyst median target)
24/7 Wall St. reports that Wall Street’s current median one-year price target for Amazon.com is $294.76, based on a group of 47 covering analysts. The publication adds that analysts in this sample generally point to ongoing AWS strength and advertising performance as central to their valuation assumptions (24/7 Wall St., 28 January 2026).
Bank of America (reiteration)
BofA Securities reduces its AMZN stock forecast to $286 from $303 while maintaining a Buy rating. The updated target incorporates a more cautious near-term view on AWS, while still outlining potential upside from advertising, cost efficiencies and margin developments (Investing.com, 27 January 2026).
Scotiabank (update)
Scotiabank raises its Amazon.com price target to $300 from $275, maintaining an ‘Outperform’ stance. The revision reflects its assessment of revenue growth prospects and operating leverage as Amazon continues to scale its retail, cloud and advertising segments (MarketBeat, 20 January 2026).
Arete Research and consensus
Arete Research increases its Amazon.com target to $285 from $283. This estimate forms against a backdrop of mixed reactions to Amazon’s Q4 2025 results and its planned multi-year capital expenditure programme, including AI-related investments (MarketBeat, 11 February 2026).
Predictions and third-party forecasts are inherently uncertain, as they cannot fully account for unexpected market developments. Past performance is not a reliable indicator of future results.
AMZN stock price: Technical overview
On the daily chart, the AMZN stock price is trading near $205.45 as of 9:20am UTC on 12 February 2026, holding below its key simple moving averages, with the 20-, 50-, 100- and 200-day moving averages clustered around 231, 232, 230 and 224 respectively. The 14-day RSI stands near 26, indicating oversold conditions rather than lower-neutral territory, while the ADX around 22 suggests a trend is present but not strongly established.
The nearest topside reference level is the classic R1 pivot near 250, with R2 around 262 coming into view only after any sustained daily close above the first pivot area. On the downside, initial support is marked by the classic pivot around 238, with the 200-day simple moving average near 224 acting as the main moving-average reference. The S1 level near 226 may serve as an additional reference point if that area fails to hold (TradingView, 12 February 2026).
This technical analysis is for informational purposes only and does not constitute financial advice or a recommendation to buy or sell any instrument.
Amazon.com share price history (2024–2026)
AMZN’s stock price has fluctuated considerably over the past two years, moving from the high-$160s in early 2024 to above $200 by early 2025, and then into a higher trading band for much of late 2025. From February 2024 to February 2025, AMZN generally traded between approximately $170 and $240, with several rallies during the spring and summer of 2024 and a year-end close around $219.85 on 31 December 2024.
During 2025, the stock spent much of the year consolidating in the low- to mid-$200s, closing at $230.80 on 31 December 2025 before a sharp decline in early February 2026 and a subsequent rebound. As of 12 February 2026, Amazon.com closed at $205.48, leaving it modestly below its late-2025 levels but still above prices seen in early 2024, reflecting a two-year period of sizeable price swings and a gradual upward shift in the trading range.
Past performance is not a reliable indicator of future results. Share prices are indicative and may differ from live market prices.
Amazon.com (AMZN): Capital.com analyst view
Amazon.com’s share price has been volatile into February 2026, declining from late-2025 levels in the low-$230s to trade closer to $205 in recent sessions. This follows a period in which the stock underperformed some broader US equity benchmarks in 2025, even as Amazon reported revenue and earnings growth. This divergence highlights how share prices can move independently of reported fundamentals over shorter timeframes.
Recent quarterly results and guidance have kept Amazon in focus. The company reported double-digit revenue growth in 2025 and outlined a $200bn capital expenditure plan for 2026, largely directed towards artificial intelligence infrastructure and AWS data centres. On one hand, stronger cash flow and sustained AWS expansion could support sentiment if investors assess these investments as contributing to future earnings capacity. On the other, the scale and timing of this capital expenditure, alongside evolving expectations for US interest rates and technology sector valuations, could weigh on the share price if markets reassess execution risks or macroeconomic conditions.
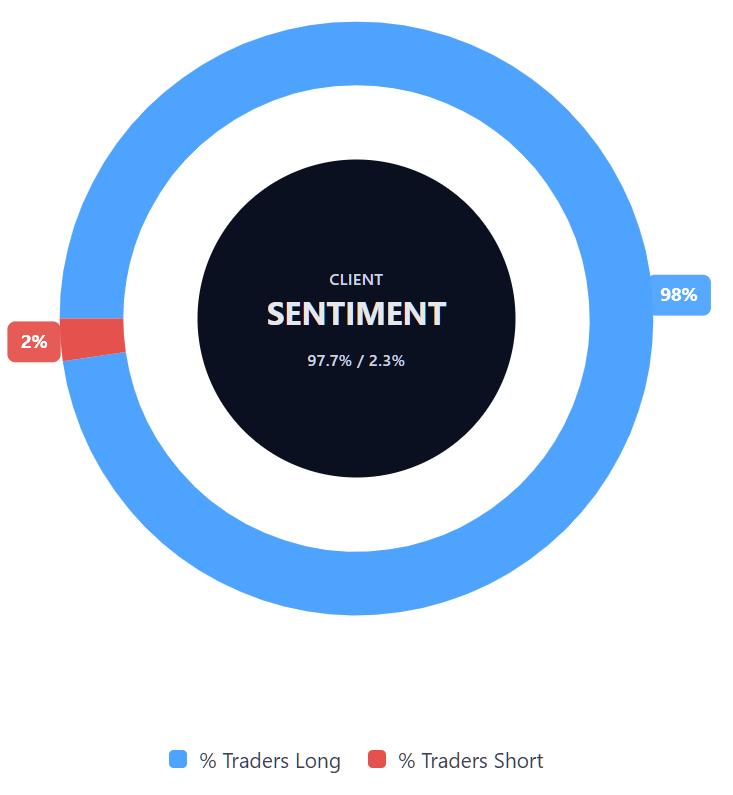
Capital.com’s client sentiment for Amazon CFDs
As of 12 February 2026, Capital.com client positioning in Amazon CFDs shows buyers at 97.7% versus sellers at 2.3%. This reflects a heavily long bias, with buyers exceeding sellers by approximately 95.4 percentage points. This snapshot is based on open positions on the Capital.com platform and can change as clients open or close trades.
Summary – Amazon.com 2026
- Amazon.com (AMZN) is quoted at approximately $205.45 as of 9:20am UTC on 12 February 2026, below its late-2025 prices in the low-$230s.
- Over the past two years, the share price has shifted from the high-$160s–$180s range in early 2024 into a higher band, trading mostly between $200 and $240 during 2025.
- Recent earnings updates point to double-digit 2025 revenue growth and a planned $200bn capital expenditure programme focused largely on AWS and AI-related infrastructure.
Past performance is not a reliable indicator of future results.
FAQ
Who owns the most Amazon.com stock?
Amazon.com’s largest shareholders typically include its founder, Jeff Bezos, alongside major institutional investors such as Vanguard Group and BlackRock, which manage funds on behalf of clients. Ownership levels can change over time as insiders sell or acquire shares and as institutions adjust their holdings. Public filings, including SEC disclosures, offer the most current publicly available information on significant shareholders and the company’s overall ownership structure.
What is the five-year Amazon.com share price forecast?
There is no single, agreed five-year AMZN stock forecast. Most published analyst targets focus on a 12-month horizon, with recent estimates clustering in the high-$280s to low-$300s. Longer-term projections tend to rely on varying assumptions about AWS growth, artificial intelligence investment, retail margins and broader economic conditions. Any extended forecast involves considerable uncertainty and may change as market conditions and company fundamentals evolve.
Is Amazon.com a good stock to buy?
Whether Amazon.com is considered a ‘good’ stock depends on an individual’s financial goals, risk tolerance and time horizon. The company operates across retail, cloud computing and advertising, which can provide diversified revenue streams. However, its share price has shown notable volatility, and large capital expenditure plans may influence short-term profitability and cash flow. As with any equity investment, potential returns need to be weighed against valuation risks, competitive pressures and wider market conditions.
Could Amazon.com stock go up or down?
Amazon.com’s share price can move in either direction, sometimes sharply, in response to earnings results, changes in guidance, macroeconomic data or shifts in investor sentiment. Developments in AWS performance, artificial intelligence investment and consumer demand may also influence price action. As with any listed company, broader market conditions and interest rate expectations can amplify gains or losses, particularly within the technology sector.
Should I invest in Amazon.com stock?
The decision to invest in Amazon.com stock is a personal one and should reflect your individual financial circumstances, objectives and risk profile. Shares can provide exposure to a large global technology business, but they also carry the risk of capital loss. You may wish to consider diversification, your investment horizon and how the position would sit within your wider portfolio before making any decision. This information is for educational purposes only and does not constitute investment advice.
Can I trade Amazon.com CFDs on Capital.com?
Yes, you can trade Amazon.com CFDs on Capital.com. Trading share CFDs lets you speculate on price movements without owning the underlying asset and to take long or short positions. However, contracts for difference (CFDs) are traded on margin, and leverage amplifies both profits and losses. You should ensure you understand how CFD trading works, assess your risk tolerance, and recognise that losses can occur quickly.