TUI stock forecast: Third-party price targets
TUI is one of Europe’s largest travel and tourism groups, with its share price often reflecting a combination of company-specific developments and broader trends across the travel and leisure sector. Explore TUI1’s recent price action, third-party price targets and technical analysis.
TUI AG (TUI1) is trading around €9.07 as of 10:45am UTC on 14 January 2026, positioned near the lower end of its intraday range, between €9.065 and €9.23, based on Capital.com’s EUR-denominated market data feed. Past performance is not a reliable indicator of future results.
The share is trading amid continued focus on TUI Group’s recently released full-year 2025 results, where the company reported record underlying Group EBIT of about €1.46 billion and revenue of approximately €24.2 billion for the financial year ended 30 September 2025 (TUI Group, 10 December 2025). Trading also takes place against a broader European travel and leisure backdrop, with the STOXX Europe 600 Travel & Leisure index posting modest gains over the past year, reflecting generally steady sector performance into early 2026 (STOXX, 14 January 2026).
TUI stock forecast 2026–2030: Third-party price targets
As of 14 January 2026, third-party TUI stock predictions indicate a range of 12-month views clustered around the low- to mid-teens in euro terms. These estimates are based on differing assumptions around travel demand, earnings development and balance-sheet progress. The figures below summarise selected external forecasts as reported at their respective publication dates and reflect 12-month or similar horizons, rather than intraday or short-term price levels.
Fintel (broker consensus snapshot)
Fintel reports an average one-year price target for TUI of €11.34 per share, within a range from €7.98 to €16.80 based on multiple covering analysts. The note frames this as a consolidated view of market expectations over the following 12 months, linked to assumptions around revenue trends and margin normalisation following recent results (Fintel, 6 December 2025).
TipRanks (aggregated 12-month forecast)
A TipRanks aggregation shows an average 12-month price target of approximately €10.43 for TUI AG. Individual analyst forecasts range from €7.90 to €13.50 over the following year. According to the service, this spread reflects views from eight Wall Street analysts, alongside ongoing consideration of earnings trends, sales stability and wider macro risks (TipRanks, 14 January 2026).
Alpha Spread (consensus target snapshot)
Equity analytics platform Alpha Spread cites Wall Street analysts’ average one-year TUI1 stock forecasts at approximately €11.45. Estimates range from a low near €7.98 to a high around €16.80. The platform notes that these targets are presented alongside its own intrinsic value modelling and are conditioned on base-case expectations for revenue growth, profitability and a normalisation of travel patterns (Alpha Spread13 January 2026).
Barclays (single-stock research action)
Barclays is reported to have reiterated its Buy rating on TUI and adjusted its 12-month TUI1 stock forecast from €11.75 to €12.00. The bank is cited as maintaining this target in the context of expected operational improvements and cost management efforts, while also acknowledging broader economic and geopolitical uncertainties affecting the travel sector (MarketScreener, 14 January 2026).
Predictions and third-party forecasts are inherently uncertain, as they cannot fully account for unexpected market developments. Past performance is not a reliable indicator of future results.
TUI1 stock price: Technical overview
The TUI1 stock price is trading around €9.07 as of 10:45am UTC on 14 January 2026, with price holding just below the 10-day moving-average cluster and remaining comfortably above its medium- and long-term trend indicators. On the daily chart, the simple 20-, 50-, 100- and 200-day moving averages sit around €9.02, €8.24, €8.11 and €7.68 respectively. This configuration keeps the 20-over-50 alignment intact and leaves the broader trend constructive while price remains above this band.
The 14-day RSI, near 57, sits in the upper-neutral zone, while an ADX reading around 28 points to an established directional trend rather than a purely range-bound environment. On the topside, the nearest classic pivot resistance appears at the R1 area around €9.70, with R2 near €10.41 coming into view on a sustained daily close above that level. On pullbacks, initial support is marked by the classic pivot around €8.74, with the 100-day simple moving average near €8.11 acting as the next notable support area. A daily close below this level could increase focus on the S1 area around €8.03 (TradingView, 14 January 2026).
This technical analysis is provided for informational purposes only and does not constitute financial advice or a recommendation to buy or sell any instrument.
TUI share price history (2024–2026)
TUI1’s stock price has moved higher over the past two years, rising from around €6.23 at the start of 2024 to approximately €9.10 by 14 January 2026. The stock recorded a strong advance through 2025, with prices climbing from roughly €6.30 in mid-April 2025 to around €9.35–€9.40 by late August, before entering a broad consolidation range between €7.00 and €9.50 into year-end. As of mid-January 2026, TUI is trading near the upper end of that range, with recent sessions clustered just below €9.40 and the latest close at €9.10 on 14 January 2026.
Past performance is not a reliable indicator of future results. Share prices are indicative and may differ from live market prices.
TUI (TUI1): Capital.com analyst view
The TUI1 stock price reflects a broader recovery trend, with the stock moving from the mid-single digits in early 2024 to trade in the high-single to low-double-digit range into January 2026. This advance has coincided with a wider rebound in European tourism and sustained demand for package holidays and cruises. However, the move has also been punctuated by periods of volatility linked to macroeconomic data, fuel costs and shifts in overall risk appetite, which have at times weighed on travel and leisure stocks.
From a fundamental perspective, TUI’s latest full-year 2025 update highlighted record underlying Group EBIT of about €1.46 billion and revenue of roughly €24.2 billion. Management also referred to reduced net debt and upgraded credit ratings in support of a new dividend policy. At the same time, guidance for 2026 pointed to only moderate revenue and profit growth within a competitive market environment. As a result, the same factors that have supported the shares – including resilient travel demand, pricing dynamics and balance-sheet repair – could also act as constraints if demand softens, costs rise more quickly than expected, or competitive and geopolitical pressures increase.
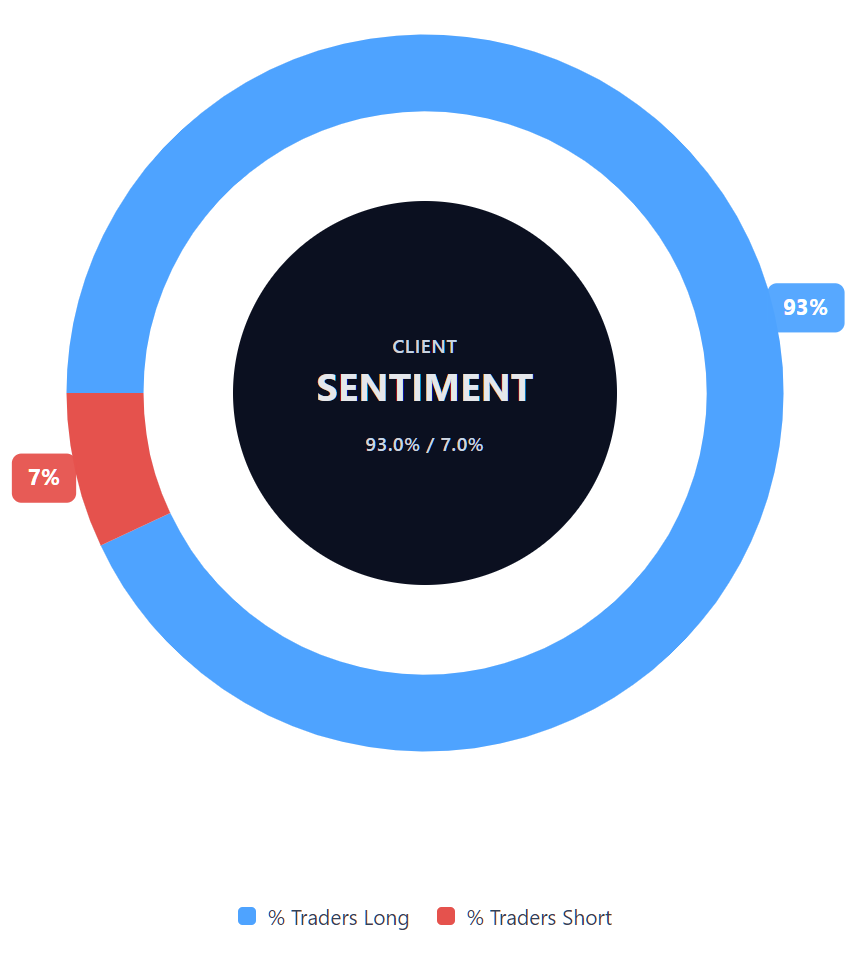
Capital.com’s client sentiment for TUI CFDs
As of 14 January 2026, Capital.com client positioning in TUI CFDs shows 93% buyers versus 7% sellers This skew suggests that positioning is currently concentrated on the upside rather than evenly balanced between directions. As with all sentiment data, this snapshot reflects open positions at a specific point in time and may change as market conditions and trading strategies evolve.
Summary – TUI stock price
- TUI traded within a rising range through 2025, climbing from around €6.20 in January to finish the year close to the €9.00 area.
- The share price accelerated from mid-2025, with repeated tests of the upper-€8.00 to low-€9.00 region as tourism demand and earnings recovery remained in focus.
- Full-year 2025 results showed TUI delivering record underlying Group EBIT of about €1.46 billion and revenue near €24.2 billion, supporting the broader recovery narrative.
- Guidance into 2026 pointed to only moderate further growth, which tempered some of the momentum in the stock despite stronger reported financial metrics.
Past performance is not a reliable indicator of future results.
FAQ
Who owns the most TUI stock?
TUI Group has a diversified shareholder base made up of institutional investors, funds and retail shareholders, rather than a single dominant owner. Large asset managers and investment funds account for a significant proportion of the free float, reflecting TUI’s inclusion in major European indices. Ownership levels can change over time as institutions rebalance portfolios and as investors enter or exit the stock, based on company performance, sector trends and broader market conditions.
What is the 5-year TUI share price forecast?
There is no single, agreed five-year share price forecast for TUI. Most publicly available analyst estimates focus on 12-month horizons and are revised regularly as new information becomes available. Over a longer timeframe, TUI’s share price is generally influenced by factors such as travel demand, cost control, balance-sheet strength, competition and macroeconomic conditions. Long-term outcomes remain uncertain and depend on how these variables evolve over time.
Is TUI a good stock to buy?
Whether TUI is considered a 'good' stock depends on individual objectives, risk tolerance and market views. Recent results show an improvement in earnings and revenue compared with previous years, but the company operates in a cyclical and competitive sector that is sensitive to economic conditions, fuel costs and geopolitical developments. Market participants assess TUI differently based on their own analysis, time horizon and expectations, and there is no guarantee that past improvements will continue.
Could TUI stock go up or down?
TUI’s share price can move both higher and lower, sometimes over short periods. Price movements may reflect changes in travel demand, company earnings, costs, investor sentiment or wider market conditions. External factors such as economic data, geopolitical events or shifts in consumer behaviour can also influence the stock. Like all shares, TUI’s price is subject to volatility, and future price movements cannot be predicted with certainty.
Should I invest in TUI stock?
Deciding whether to invest in TUI is a personal decision that depends on your financial situation, objectives and understanding of risk. Shares can rise or fall in value, and losses are possible. This information is provided for general market context only and does not constitute investment advice or a recommendation. You may wish to consider a range of factors and, where appropriate, seek independent financial advice before making any investment decisions.
Can I trade TUI CFDs on Capital.com?
Yes, you can trade TUI CFDs on Capital.com. Trading share CFDs lets you speculate on price movements without owning the underlying asset and to take long or short positions. However, contracts for difference (CFDs) are traded on margin, and leverage amplifies both profits and losses. You should ensure you understand how CFD trading works, assess your risk tolerance, and recognise that losses can occur quickly.