SAP SE stock forecast: Third-party price targets
SAP SE (SAP) is trading at $233.80 as of 9:24am UTC on 20 October 2025, with intraday moves between a low of $227.45 and a high of $234.40. The share price remains near the upper end of this session’s range.
SAP shares currently trade broadly in line with European equities, with earnings expected on 22 October 2025.
SAP SE stock forecast: Analyst price target view
Bernstein (Outperform rating)
Bernstein retains an Outperform rating with a price target of €294.00, ahead of the company’s third-quarter earnings release. The research firm expects SAP to maintain its fiscal 2025 guidance at constant currency, supported by the S/4 migration cycle and continued cloud backlog growth, which could offset potential demand weakness (Investing.com, 20 October 2025).
Goldman Sachs (investment bank)
Goldman Sachs reaffirmed a Buy rating and a €310.00 price target (approximately $344.00), ahead of the third-quarter results. The bank noted that SAP remains in the early stages of its S/4 HANA migration cycle, with sustained cloud backlog growth and AI-related opportunities providing medium-term support. The upcoming 2027 and 2030 migration deadlines are expected to underpin ERP upgrade demand (Investing.com, 30 September 2025).
Deutsche Bank (Buy rating)
Deutsche Bank reduced its price target to €270.00 from €300.00, maintaining a Buy rating. Analyst Johannes Schaller wrote that while the demand environment has softened, SAP’s underlying growth momentum remains intact (MarketScreener, 22 September 2025).
Morgan Stanley (investment bank)
Morgan Stanley maintained an Overweight rating and named SAP a Top Pick on 24 September 2025, citing a favourable long-term valuation despite near-term macroeconomic pressures. The bank revised its cloud backlog growth forecast downward from 28% in Q2 to 26% in Q3 and 25% in Q4, with its fiscal 2026 cloud revenue growth projection trimmed to 24% from 25% at constant currency. It added that the S/4 migration schedule and limited alternative options are likely to sustain customer upgrades (Yahoo Finance, 24 September 2025).
Jefferies (investment bank)
Jefferies maintained a Buy rating and a €290.00 price target (approximately $322.00) as of 16 September 2025, following a discussion with the company’s CFO. The firm noted that cloud order intake and free cash flow projections appear stronger than market expectations, with SAP positioned for steady revenue expansion, margin improvement, and stronger free cash flow generation. Jefferies added that multiple growth drivers and a consistent strategic approach could support longer-term performance (TipRanks, 16 September 2025).
Predictions and third-party forecasts are often subject to change, as they can’t account for unexpected market events. Past performance is not a reliable indicator of future results.
SAP stock price: Technical overview
SAP shares trade at $233.80 as of 9:24am UTC on 20 October 2025, after moving between an intraday low of $227.45 and a high of $234.40. The stock remains above its shorter-term moving average cluster – the 10-, 20-, 30-, and 50-day SMAs at approximately $234 / $231 / $228 / $230 – with the 20-over-50 alignment intact, keeping the near-term trend moderately constructive.
Momentum is neutral to slightly positive; the 14-day RSI reads 54.05, in upper-neutral territory, suggesting scope for further gains without stretched conditions. The ADX, at 18.36, indicates a weak overall trend. The MACD and Momentum indicators both show mild bullish signals, consistent with a short-term upward bias as long as the price holds above the moving-average base.
The first area to monitor on the upside is the Classic R1 pivot near $239.80; a daily close above this level would bring the R2 figure around $251.70 into focus. On pullbacks, initial support lies at the Classic Pivot (P) near $224.75, followed by the longer-term moving averages around $243 (100-day SMA) and $250 (200-day SMA). A sustained move below the pivot could weaken short-term momentum and may support a deeper retracement toward these longer-term averages (TradingView, 20 October 2025).
This analysis is provided for informational purposes only and does not constitute financial advice or a recommendation to buy or sell any instrument.
SAP SE share price history
SAP SE was listed on the New York Stock Exchange in 1998, and the shares have traded under the ticker SAP since then.
The stock opened 2024 at around $137.00, then climbed steadily throughout the year as the firm’s cloud revenue transition gained momentum. SAP reached a sharp inflection point in late January 2024, rising from $149.00 to $161.00 within weeks, and maintained that upward trajectory through spring and summer. By early October 2024, the shares were trading near $200.00, marking a roughly 46% increase over nine months.
The rally continued into 2025 as demand for SAP’s cloud ERP suite and AI tools strengthened. In January, the stock advanced from $235.00 to $269.00 by month-end, then climbed to a peak of $283.15 on 19 February 2025. From there, shares moved lower through the northern spring and summer, declining to $209.45 on 16 September 2025 amid currency headwinds and softer demand in certain sectors. A modest recovery followed in early October, with SAP briefly reaching $239.10 on 9 October before easing again.
SAP closed at $233.85 on 20 October 2025, approximately 0.9% below the 30 December 2024 close of $235.90.
Past performance is not a reliable indicator of future results. Share prices are indicative and may differ from live market prices.
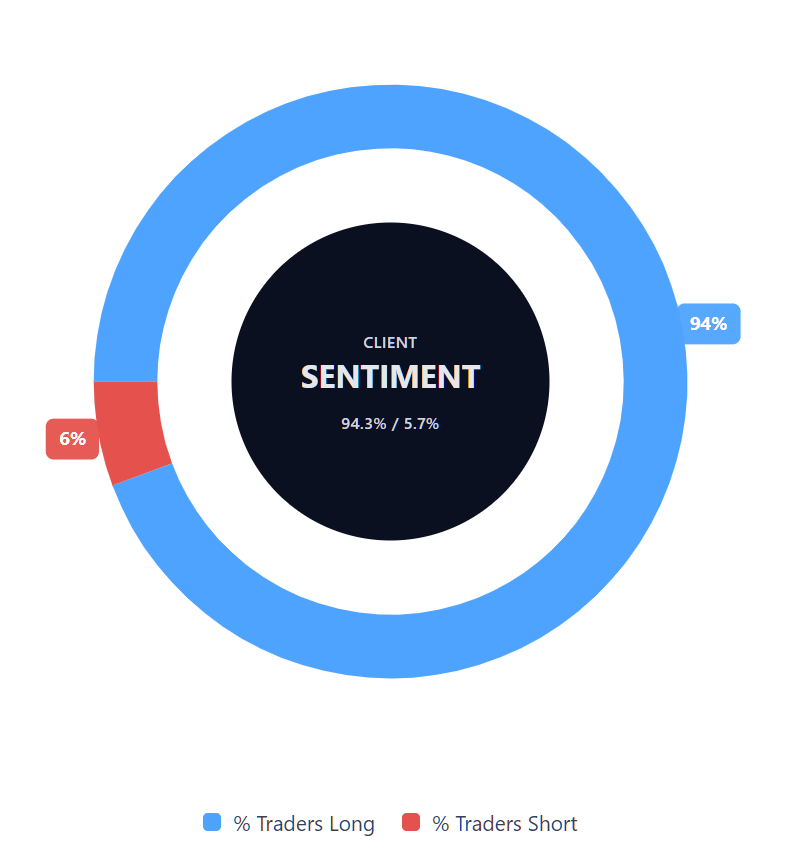
Capital.com’s client sentiment for SAP CFDs
As of 20 October 2025, Capital.com client positioning in SAP CFDs shows a strong bias towards long positions, with 94.3% buyers and 5.7% sellers. This puts buyers ahead by 88.5 percentage points, indicating a predominantly bullish client stance.
This snapshot represents current open positions on Capital.com and is subject to change over time.
FAQ
Is SAP SE a good stock to buy?
This depends on individual objectives, risk tolerance, and time horizon. Analysts currently maintain a range of ratings from Buy to Outperform, with most targets clustered between €270.00 and €310.00. These figures represent third-party assessments based on SAP’s cloud transition and software demand, but they do not guarantee future results.
Could SAP SE stock go up or down?
Like any listed share, SAP SE’s price can move in either direction depending on market conditions, earnings performance, exchange rates, and broader economic sentiment. Technical indicators currently suggest neutral to slightly positive momentum, although market dynamics can shift quickly.
Should I invest in SAP SE stock?
Capital.com does not provide investment advice. Anyone considering exposure to SAP SE or related instruments should evaluate their financial position and trading goals carefully, and ensure they understand the risks involved in leveraged products such as CFDs.
Where can I trade or follow SAP SE price movements?
SAP SE can be followed or traded as a contract for difference (CFD) on the Capital.com platform, allowing users to speculate on price movements without owning the underlying shares. Traders can go long or short depending on their market outlook, while using built-in risk management tools such as stop-loss and take-profit orders. Be aware that standard stop-loss orders are not guaranteed, while guaranteed stop-loss orders incur a fee if activated. CFDs are traded on margin, and leverage amplifies both your profits and your losses.