Novo Nordisk stock forecast: Third-party price targets
Novo Nordisk’s share price has seen several shifts through 2025, influenced by company updates, developments across the wider sector and broader market conditions.
Novo Nordisk (NVO) is trading around $47.61 per share in intraday action, within a session range of $47.26–$48.47 based on Capital.com pricing as of 3.39pm UTC on 3 December 2025, with client positioning skewed toward buyers. The move follows a period of volatility that saw the stock approach multi-year lows in late November, as the market continued to process company-specific developments and broader sector trends.
The current session comes amid ongoing reaction to late-November updates on semaglutide Alzheimer’s trials, which outlined that key studies did not meet their primary endpoints (Reuters, 24 November 2025). At the same time, the company’s reported nine-month 2025 sales and operating-profit growth remain in focus (Novo Nordisk, accessed 3 December 2025), alongside recent regulatory filings for a higher Wegovy dose (PR Newswire, 26 November 2025) and additions to its obesity portfolio (Reuters, 2 December 2025).
Past performance is not a reliable indicator of future results.
Novo Nordisk stock forecast 2026–2030: Analyst price targets
Third-party Novo Nordisk price forecasts published between October and December 2025 show a broad range of expectations. These targets are drawn from third-party research and data providers and represent indicative 12-month views rather than predictions of future performance.
Stock Analysis (consensus snapshot)
Stock Analysis reports that four analysts covering Novo Nordisk have an average 12-month price target of about $54.25, with individual estimates ranging from $46 to $70. The site notes that these figures reflect mixed ratings, as analysts factor in recent price volatility following guidance changes and uncertainty around demand for obesity and diabetes treatments (Stock Analysis, 3 December 2025).
MarketBeat (broker coverage summary)
MarketBeat states in a November 2025 update that brokerages covering Novo Nordisk have an average 12-month price target of approximately $56.83 per share. The consensus sits within a wide dispersion of views, as analysts reassess assumptions on growth, margins and competition following the sharp share-price decline in 2025 (MarketBeat, 29 November 2025).
24/7 Wall St. (analyst aggregation and house model)
In a November 2025 report, 24/7 Wall St. cites a consensus 12-month target of about $55.97, while its in-house model projects a year-end price closer to $59.64. The article notes that these projections consider expected contributions from the company’s obesity and diabetes portfolio, broader pipeline developments and acquisition activity, set against reduced guidance and competitive pressures (24/7 Wall St, 21 November 2025).
TipRanks (Wall Street average)
TipRanks, states that 10 Wall Street analysts have issued 12-month targets for Novo Nordisk, with an average of around $58.19, a low of $46 and a high of $70. According to the platform, the moderate-buy consensus and target dispersion reflect differing views on the pace at which profitability and growth could stabilise after a year of downgrades and forecast revisions (TipRanks, 3 December 2025).
BMO Capital via Nasdaq (selected broker detail)
A November 2025 BMO Capital report indicates that the average one-year price target for Novo Nordisk A is $66.81, within a range of roughly $43.88 to $117.29. The note highlights that this implies significant variation in outlook, as analysts weigh the impact of guidance changes against the firm’s position in obesity and diabetes therapies (Nasdaq, 25 November 2025).
Predictions and third-party forecasts are inherently uncertain and may not account for unexpected market developments. Past performance is not a reliable indicator of future results.
NVO stock price: Technical overview
NVO is trading around $47.61 as of 3.39pm UTC on 3 December 2025, sitting just below the short-term 10-day simple moving average (SMA) near 47.8 and below the 20- and 50-day SMAs around 47.9 and 52.3. The longer-term picture remains under pressure, with the 100- and 200-day SMAs higher at roughly 54.5 and 63.3. This keeps the broader moving-average structure tilted to the downside while intraday action stays within the 47.26–48.47 range on Capital.com’s feed.
In terms of momentum, the 14-day RSI around 44.8 sits in mid-neutral territory. The ADX near 19.8 points to a relatively weak directional trend. The nearest classic pivot resistance above the last traded price is R1 at around 52.2; a daily close above this level would bring the R2 region near 55.0 into view. Initial support sits at the classic pivot P around 47.6, while the S1 area near 44.8 may come into focus if the pivot level fails. The 100-day SMA around 54.5 remains a notable longer-term technical reference point (TradingView, 3 December 2025).
This technical analysis is provided for information only and does not constitute financial advice or a recommendation to buy or sell any instrument.
Novo Nordisk share price history
NVO’s stock price (US-listed shares) spent much of 2024 trading well above $100, reaching the mid-$140s in July before easing into year-end, closing at $86.22 on 31 December. Through early 2025 the price generally hovered between the low-$80s and low-$90s, with intraday highs above $90 in February and March.
From late March to mid-June 2025, NVO moved higher again, recording closes above $80 in March and revisiting the $80 area in mid-June before a sharp reversal. After closing at $74.01 on 20 June, the stock entered a sustained downtrend, slipping from the high-$70s and low-$70s in late June and July to the mid-$50s by late August, then to the low-$50s in October. The decline accelerated into November, with prices falling from above $50 in early November to the mid-$40s later in the month. By 3 December 2025 the stock had closed at $47.73, placing it well below levels seen a year earlier.
Past performance is not a reliable indicator of future results. Share prices are indicative and may differ from live market prices.
Capital.com analyst view
The NVO stock price has undergone a notable reset over the past year, falling from triple-digit levels in late 2024 to below $50 by early December 2025. Market participants have been reassessing earnings momentum, guidance and clinical updates, which has contributed to this repricing. Recent sessions show more contained intraday moves within the mid- to high-$40s, contrasting with periods of wider swings earlier in 2025.
Several themes appear central to how traders assess price action, including demand trends for obesity and diabetes treatments, regulatory and pricing developments, and confidence in late-stage pipeline progress. Favourable updates can support revenue expectations and margins, but may also prompt questions about valuation if positive developments are already reflected in the share price. Conversely, setbacks in trials, guidance or policy can weigh on the stock, though some traders may view sharp declines as potential overreactions depending on their risk tolerance and time horizon.
Capital.com’s client sentiment for Novo Nordisk CFDs
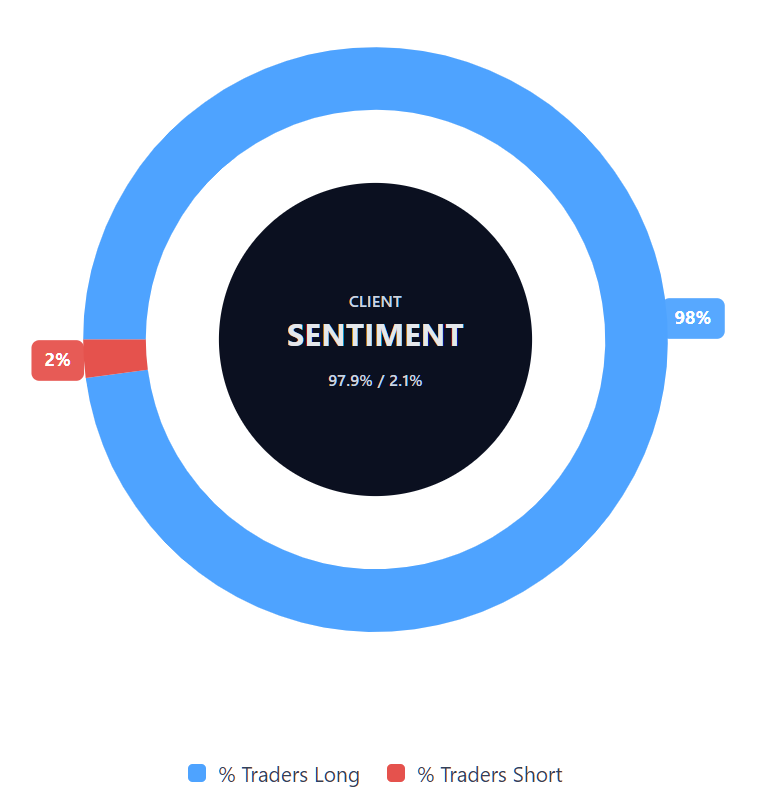
As of 3 December 2025, Capital.com client positioning in Novo Nordisk CFDs is currently skewed toward longs, with buyers at 97.9% versus sellers at 2.1%. This indicates that many clients presently hold upside exposure. However, highly asymmetric positioning can also be interpreted in different ways, including by contrarian traders who may view concentrated sentiment as a potential sign of future repositioning. This snapshot reflects open positions on Capital.com and may change.
Summary – Novo Nordisk price 2025
- Novo Nordisk’s US-listed share price moved from the mid-$80s at the start of 2025 to below $50 by early December.
- The steepest decline occurred between June and November, when the price fell from the $70s into the $40s.
- By December, the stock was trading below key medium- and long-term moving averages, with short-term indicators showing neutral conditions.
- Capital.com client sentiment was heavily long, with around 97.9% of open positions held by buyers.
Past performance is not a reliable indicator of future results.
FAQ
Who owns the most Novo Nordisk stock?
Novo Nordisk’s largest shareholders generally include major institutional investors, long-term asset managers and pension funds, alongside the Novo Nordisk Foundation. Through Novo Holdings, the Foundation retains a controlling interest, meaning a significant portion of voting rights sits with long-standing strategic owners. The remaining shares are held by a wide mix of global institutions and retail investors.
What is the 5 year forecast for Novo Nordisk stock?
Five-year forecasts for Novo Nordisk differ across analysts and data providers, largely because they rely on changing assumptions about demand for obesity and diabetes treatments, potential regulatory developments and progress in the company’s late-stage pipeline. Long-term estimates are uncertain and frequently adjusted as new information emerges, and they should be viewed as indicative opinions rather than predictions of future performance.
Is Novo Nordisk a good stock to buy?
Assessing whether Novo Nordisk is suitable for a particular trader depends on personal goals, risk tolerance and familiarity with the risks associated with equities. The company operates in areas of significant public and commercial interest, but it also faces competition, pricing pressures and clinical-trial uncertainty. Its share price can rise or fall in response to new information, so suitability will vary from one individual to another.
Could Novo Nordisk stock go up or down?
Like any listed company, Novo Nordisk’s share price may move in either direction based on market conditions, regulatory updates, financial results and broader sentiment. The wide spread of analyst targets reflects differing assumptions about future performance. Market outcomes are inherently uncertain, and unexpected events can influence prices over both short and long time periods. Past performance is not a reliable indicator of future results.
Should I invest in Novo Nordisk stock?
Whether to invest in Novo Nordisk depends on your financial situation, experience and approach to risk. Share prices fluctuate, and company-specific developments or wider economic factors can affect returns. It’s important to understand the risks involved and consider whether exposure to this type of asset fits your objectives. Capital.com does not provide investment advice.
How can I trade Novo Nordisk CFDs on Capital.com?
To trade Novo Nordisk CFDs on Capital.com, you can open an account, verify your details and access the market through our platform or app. You can go long or short, apply risk-management tools such as take-profit and stop-loss orders, and track price movements with customisable charts and indicators. Contracts for difference (CFDs) are traded on margin, and leverage amplifies both profits and losses.*
*Standard stop-loss orders are not guaranteed. Guaranteed stop-loss orders (GSLOs) incur a fee if activated.