

Intel stock forecast: PC processor price increase
Intel is a US semiconductor company. In September 2026, reports said it planned a roughly 10% increase in PC processor prices from 5 October. Explore third-party INTC price targets and technical analysis. Past performance is not a reliable indicator of future results.
Intel Corporation (INTC) traded at $105.39 as of 2:28pm UTC on 9 September 2026, within an intraday range of $97.37–$105.83. Past performance is not a reliable indicator of future results.
The move came as reports said Intel planned to raise personal computer processor prices by roughly 10% from 5 October 2026, according to DigiTimes and Dow Jones Newswires (Yahoo Finance, 8 September 2026). Separately, Intel and ASML confirmed that High-NA extreme ultraviolet lithography equipment had entered high-volume manufacturing at Intel facilities (ASML, 8 September 2026).
Third-party Intel outlook: CPU pricing
As of 9 September 2026, third-party Intel stock predictions span a wide range over the next 12 months, reflecting different assumptions around foundry expansion, pricing, margins and AI-related demand.
Bank of America Securities
Bank of America Securities maintains a buy rating and cuts its 12-month target to $145 from $160. The revision reflects its assessment of Intel's data centre and AI-related revenue trajectory for the second half of 2026 (Yahoo Finance, 13 August 2026).
UBS Group
UBS maintains a neutral rating and lowers its 12-month target to $112 from $121. The bank cites margin pressure associated with Intel's continued foundry investment cycle as a factor behind the reduction (Yahoo Finance, 12 August 2026).
Mizuho Securities
Mizuho lowers its 12-month target to $92 from $109 while maintaining a neutral rating. The firm points to the risk of valuation multiple compression, while tighter server CPU supply could provide an offset (Investing.com, 3 September 2026).
Northland Securities
Northland Securities analyst Gus Richard upgrades Intel to outperform from market perform and sets a 12-month target of $120. The analyst cites the Terafab manufacturing venture and prospects for greater foundry scale as factors supporting the projection (Finbold, 8 September 2026).
Ticker Nerd
Ticker Nerd reports a median 12-month target of $112 across 48 Wall Street analysts, with estimates ranging from $75–$200. The consensus comprises 14 buy, 32 hold and two sell recommendations. The site also reports that earnings-per-share estimates for the next fiscal year rose 38.9% over the previous 90 days (Ticker Nerd, 7 September 2026).
Predictions and third-party forecasts are inherently uncertain, as they cannot fully account for unexpected market developments. Past performance is not a reliable indicator of future results.
Intel earnings: latest results and upcoming report
Intel reported second-quarter 2026 results on 23 July. Revenue reached $16.1bn, up 25% year on year, while non-GAAP earnings per share came in at $0.42. GAAP loss per share was $2.16, reflecting one-off charges. Data Center and AI Group revenue also increased, while cash from operations totalled $7bn.
For the third quarter, Intel guided revenue to $15.8bn–$16.8bn and non-GAAP earnings per share of approximately $0.38 at the midpoint (SEC, 23 July 2026).
Intel has not yet confirmed its next earnings date. MarketBeat lists 22 October 2026 as an estimated date based on the company's historical reporting pattern (MarketBeat, 23 July 2026).
Intel typically confirms earnings dates through its newsroom and investor relations channels, which also provide access to quarterly webcasts (Intel Newsroom, 30 June 2026).
INTC stock price: technical overview
As of 2:28pm UTC on 9 September 2026, the INTC stock price trades above its listed 20-, 50-, 100- and 200-day simple moving averages at approximately $95, $100, $105 and $75 respectively. The latest price sits closest to the 100-day average, while the 200-day exponential moving average near $80 provides another longer-term reference below current levels, according to TradingView.
The 14-day relative strength index (RSI) stands near 62, above its neutral midpoint but below commonly watched overbought levels. The average directional index (ADX) near 15 indicates limited trend strength without indicating future price direction.
The classic R1 pivot near $103 sits below the latest price, while R2 around $117 provides a higher reference. Below current levels, $103 and the classic pivot around $94 provide nearer references, followed by the 200-day simple moving average near $75.
A move higher could bring $117 into focus, while a decline could shift attention towards $103 and $94 (TradingView, 9 September 2026).
This is technical analysis for informational purposes only and does not constitute investment advice or a recommendation to buy or sell any instrument.
Intel share price history (2024–2026)
INTC’s stock price had moved substantially over the past two years. The stock closed at $19.01 on 10 September 2024 before falling to a two-year low of $17.72 on 8 April 2025 during broader weakness in semiconductor stocks following tariff announcements.
INTC recovered through 2025, ending the year at $36.93 during a period of US government support and foundry restructuring developments. The rise continued in 2026, with shares moving above $67 in late April before reaching $139.45 on 30 June. They subsequently pulled back into the $90s by early August as investors assessed dilution concerns linked to a large equity raise.
By 9 September 2026, INTC was trading around $105, approximately 166.5% higher year to date and around 454.6% above its 10 September 2024 close. The period included substantial movements in both directions.

Past performance is not a reliable indicator of future results. Share prices are indicative and may differ from live market prices.
Intel (INTC): Capital.com analyst view
Intel shares have shown substantial volatility alongside a multi-month rise in 2026, moving from around $40 in early January to above $105 by early September. This period has coincided with the US government's equity stake, renewed foundry investment, reported processor price increases and broader spending on AI infrastructure. The shares have also experienced significant pullbacks, including a move from above $139 in late June to below $80 in July.
Further foundry progress, higher processor pricing or AI-related demand could support revenue expectations and sentiment if execution develops as expected. Conversely, continued foundry losses, weaker demand, margin pressure or shareholder dilution could weigh on the shares. The wide range of analyst targets reflects different views on how these factors may develop.
Capital.com’s client sentiment for Intel CFDs
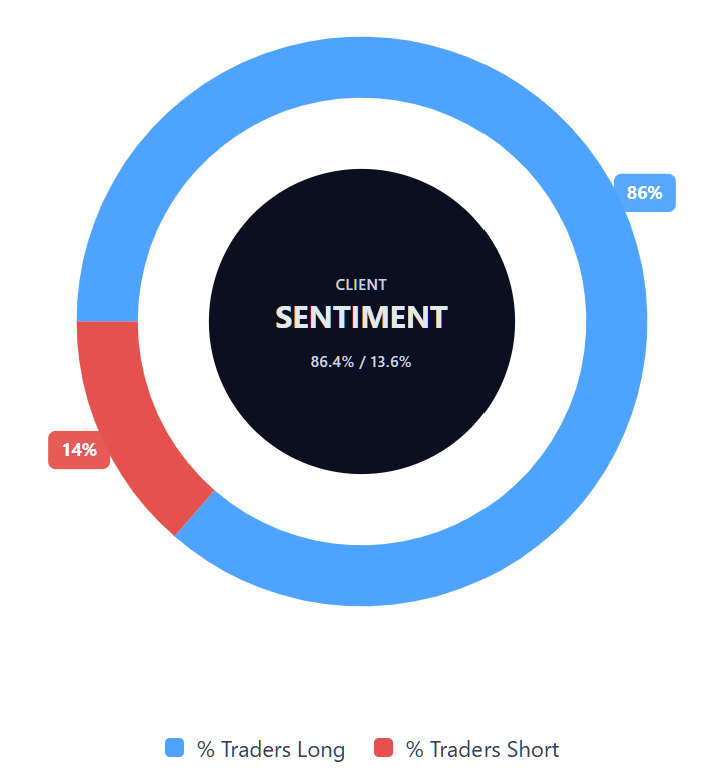
As of 9 September 2026, Capital.com client positioning in Intel CFDs is weighted towards long positions, with 86.4% long and 13.6% short. This reflects open positions on Capital.com at the time of measurement rather than future price direction and can change.
Summary – Intel 2026
- As of 2:28pm UTC on 9 September 2026, Intel traded near $105.39, within an intraday range of $97.37–$105.83.
- According to TradingView data, the price was above its listed 20-, 50-, 100- and 200-day moving averages, while RSI stood near 62 and ADX near 15, indicating limited trend strength.
- Key factors include reported CPU price increases, foundry progress, the Northland Securities upgrade and continued US government involvement.
- Higher pricing, AI-related demand or improved foundry execution could support sentiment, while weaker demand, margin pressure or dilution could weigh on the shares.
Past performance is not a reliable indicator of future results.
FAQ
Who owns the most Intel stock?
What is the five-year Intel share price forecast?
Is Intel a good stock to buy?
Could Intel stock go up or down?
Should I invest in Intel stock?
Can I trade Intel CFDs on Capital.com?
Yes, you can trade Intel CFDs on Capital.com. Trading share CFDs lets you speculate on price movements without owning the underlying asset and to take long or short positions. However, contracts for difference (CFDs) are traded on margin, and leverage amplifies both profits and losses. You should ensure you understand how CFD trading works, assess your risk tolerance, and recognise that losses can occur quickly.