

IonQ stock forecast: Third-party price targets
IonQ develops trapped-ion quantum systems and reported a $96.80m adjusted EBITDA loss in the first quarter of 2026 as it worked towards a 256-qubit system. Explore third-party IONQ price targets and technical analysis. Past performance is not a reliable indicator of future results.
IonQ, Inc. (IONQ) last traded around $34.21 at 9.25am UTC on 27 July 2026, within Monday’s intraday range of $32.67–$34.48 and below the $34.48 session high reached in early European trading. Past performance is not a reliable indicator of future results.
The pullback comes amid a broader sell-off in quantum-computing stocks. CNBC's Jim Cramer noted on 22 July that rate-sensitive, loss-making growth stocks such as IONQ may become less attractive as interest rates rise (CNBC, 23 July 2026).
Concerns about execution and profitability have added to the pressure. Zacks reported on 25 July that IonQ posted a $96.80m adjusted earnings before interest, tax, depreciation and amortisation (EBITDA) loss in the first quarter of 2026, while continuing to invest in its target of developing a 256-qubit system by the fourth quarter (Zacks, 22 July 2026).
Attention is also turning to IonQ's confirmed release of second-quarter 2026 financial results, according to the company's filing with the US Securities and Exchange Commission (SEC), cited by Yahoo Finance (Yahoo Finance, 25 July 2026), corroborated by the company's own investor relations announcement of the August 5, 2026 release date (IonQ Investor Relations, 24 July 2026).
Third-party IonQ outlook: Q2 earnings near
As of 27 July 2026, third-party IonQ, Inc. stock predictions span a range of 12-month targets, shaped by quantum-hardware milestones, federal policy support and revenue growth expectations.
MarketScreener (buy-leaning consensus)
MarketScreener's composite panel projects an average 12-month target price of $75 for IonQ, up from a previous figure of $60, based on coverage from its broker research feed. The revision reflects expectations of further demand for quantum hardware and broader federal policy support (MarketScreener, 5 July 2026).
Investing.com (consensus overview)
Investing.com projects an average 12-month share price target of $69.11 for IonQ, based on forecasts from 12 analysts. Estimates range from $30 to $100. The spread reflects differing assumptions about the pace of enterprise adoption of IonQ's trapped-ion systems over the coming year (Investing.com, 15 July 2026).
MarketBeat (consensus overview)
MarketBeat projects an average 12-month price target of $69.88 across 17 analysts, with forecasts ranging from $35 to $100 and an overall buy-leaning rating. The projection balances expectations of commercial growth with continued short-term pressure on profitability ahead of the company's next earnings release (MarketBeat, 17 July 2026).
Public.com (consensus overview)
Public.com projects an aggregate 12-month price target of $71.25, based on 12 analysts and a consensus buy rating. Of those analysts, 42% recommend 'strong buy'. The forecast reflects expectations for IonQ's commercial pipeline, although some analysts also identify valuation risk (Public.com, 23 July 2026).
Anachart (analyst price target tracker)
Anachart projects an average 12-month price target of $72.40 across nine analysts, with estimates ranging from $35 to $100. These figures sit above the share price at the time of the forecast. The tracker estimates that the average target could be reached in about 129 days, although this depends on IonQ's progress against its qubit-scaling roadmap (Anachart, 23 July 2026).
Predictions and third-party forecasts are inherently uncertain, as they cannot fully account for unexpected market developments. Past performance is not a reliable indicator of future results.
IonQ upcoming earnings expected on 5 August 2026
IonQ confirmed that it will report second-quarter 2026 financial results on Wednesday, 5 August 2026. A conference call and webcast will follow at 4.30pm ET, according to the company's investor relations page (IonQ Investor Relations, 24 July 2026).
The release will cover the quarter ended 30 June 2026 and follows the company's first-quarter results, published on 6 May 2026. IonQ reported generally accepted accounting principles (GAAP) revenue of $64.70m, up 754.7% year on year and 30% above the midpoint of its guidance range (IonQ Investor Relations, 6 May 2026).
Alongside those results, IonQ issued full-year 2026 revenue guidance of $260m–$270m, compared with a previous consensus estimate of about $236.30m, according to MarketBeat. The report also showed a GAAP net loss of $0.34 a share, compared with the consensus estimate of a $0.26 loss a share (MarketBeat, 25 July 2026).
IONQ stock price: technical overview
As of 9.25am UTC on 27 July 2026, the IONQ stock price trades at $34.21, below its main moving-average cluster. The 20-day, 50-day, 100-day and 200-day simple moving averages (SMAs) stand at about $42, $52, $45 and $47 respectively, placing the share price below the broader moving-average range on TradingView’s daily chart. The 20-day SMA also sits below the 50-day SMA, so the averages do not currently show a bullish alignment.
Momentum indicators also point to recent downward pressure. The 14-day relative strength index (RSI) is near 26, a level commonly described as oversold, while the average directional index (ADX) reading of 40.21 suggests a relatively established trend, without indicating its direction.
The nearest listed classic resistance pivot is R1 at about $68.44, well above the current price. A move above this level could bring the R2 pivot near $83.63 into focus, according to TradingView’s classic pivot table.
The share price is already below the central pivot at about $58.47, the S1 pivot near $43.28 and the 100-day and 200-day SMAs near $45 and $47 respectively. The next listed classic support pivot is S2 at about $33.31, close to the current price. A move below that level could bring lower support areas into focus, while a recovery above S1 and the moving-average cluster could shift attention back towards the central pivot (TradingView, 27 July 2026).
These levels are based on TradingView data and may change over time. This technical analysis is for informational purposes only and does not constitute financial advice or a recommendation to buy or sell any instrument.
IonQ, Inc. share price history (2024–2026)
IONQ’s stock price traded in single digits in mid-2024, closing at $7.92 on 29 July 2024. It then rose through the second half of the year and into 2025 as market interest in quantum-computing companies increased.
The stock moved through the $40–$60 range before reaching a recorded high of $84.68 on 13 October 2025, amid increased attention on trapped-ion technology and federal quantum-policy support. The price then reversed. By April 2026, IONQ had fallen to $27.93 during a broader technology-sector sell-off, before rising to $65.51 on 9 June 2026 as interest in the sector increased again.
Since the June high, the shares have moved lower, closing at $34.19 on 27 July 2026. This represented a decline of about 27% from the $46.57 close on 2 January 2026 and a year-on-year fall of roughly 22% from the $44.02 close on 24 July 2025.

Past performance is not a reliable indicator of future results. Share prices are indicative and may differ from live market prices.
IonQ, Inc. (IONQ): Capital.com analyst view
IonQ’s share price performance in 2026 has featured sharp swings rather than a consistent direction. The stock climbed to about $65 in June before retreating to around $34.21 by late July.
These movements may reflect changing assessments of quantum computing’s long-term commercial potential against shorter-term factors, including continued net losses and a revenue base that remains small relative to the company’s market valuation. Federal quantum-policy initiatives and reported revenue growth have attracted market attention, while sensitivity to interest rates across the technology sector and concerns about profitability may have weighed on the shares.
Some observers consider pullbacks a feature of an early-stage company operating in a developing industry. Others suggest that large price movements could partly reflect liquidity conditions and speculative positioning, rather than changes in underlying business performance alone.
Capital.com’s client sentiment for IonQ CFDs
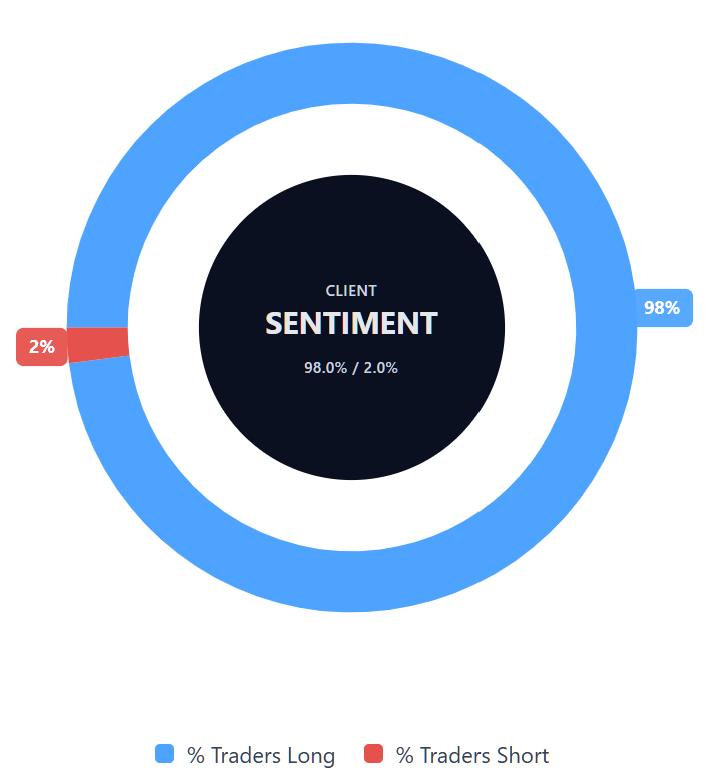
As of 27 July 2026, Capital.com client positioning in IonQ CFDs is weighted towards long positions, with 98% long and 2% short. This places long positions 96 percentage points above short positions.
The figures represent open positions held by Capital.com clients at the time of measurement and may change as market conditions and client activity evolve. Client sentiment does not predict future price movements and should not be used as the sole basis for a trading decision.
Summary – IonQ, Inc. 2026
- As of 9.25am UTC on 27 July 2026, IonQ traded near $34.21, below its June high of $65.51 but above the single-digit levels recorded in mid-2024.
- IONQ remained below its main moving-average cluster, with an RSI near 26 indicating oversold conditions and no bullish alignment across the averages.
- Key influences include quantum-hardware milestones, federal policy support and revenue growth, balanced against profitability pressure and interest-rate sensitivity.
- Attention is now on the 5 August 2026 earnings release, updated guidance and progress on IonQ’s qubit-scaling roadmap. These factors don’t determine future performance, and analyst forecasts may not be realised.
Past performance is not a reliable indicator of future results.
FAQ
Who owns the most IonQ stock?
The article doesn’t identify IonQ’s largest shareholder, and ownership levels can change as institutional investors, company insiders and other shareholders adjust their positions. Investors can review IonQ’s latest regulatory filings for the most recent information on major holdings and insider ownership. Shareholder concentration may affect liquidity and market behaviour, but it doesn’t by itself indicate how the share price will perform.
What is the five-year IonQ share price forecast?
The article doesn’t include a five-year IONQ stock forecast. The third-party projections discussed cover a 12-month period, with average targets of about $69–$75 and high estimates of $100. Longer-term forecasts carry greater uncertainty because they depend on factors including technological progress, commercial adoption, revenue growth, funding requirements and profitability. Analyst targets can change and may not be realised.
Is IonQ a good stock to buy?
Whether IonQ is suitable depends on an individual’s objectives, risk tolerance and financial circumstances. The article highlights potential drivers such as quantum-hardware development, policy support and revenue growth, alongside continued losses, valuation concerns and sensitivity to interest rates. IonQ’s share price has also experienced substantial volatility. This information doesn’t constitute investment advice, and no forecast can determine whether the stock will produce gains or losses.
Could IonQ, Inc. stock go up or down?
Yes. IonQ’s share price could move in either direction. Positive developments in its qubit-scaling roadmap, commercial pipeline or revenue outlook could influence sentiment, while weaker execution, persistent losses, valuation concerns or broader pressure on growth stocks could weigh on the price. The article also shows that IONQ has recorded sharp gains and declines over relatively short periods. Past performance doesn’t reliably indicate future results.
Should I invest in IonQ, Inc. stock?
The article can’t determine whether you should invest in IonQ. That decision depends on your financial position, investment horizon, objectives and capacity for loss. IonQ operates in an emerging sector and combines potential long-term opportunities with considerable uncertainty around commercial adoption, profitability and valuation. Consider conducting independent research and, where appropriate, seeking advice from a qualified financial professional before making an investment decision.
Can I trade IonQ CFDs on Capital.com?
Yes, you can trade IonQ CFDs on Capital.com. Trading share CFDs lets you speculate on price movements without owning the underlying asset and to take long or short positions. However, contracts for difference (CFDs) are traded on margin, and leverage amplifies both profits and losses. You should ensure you understand how CFD trading works, assess your risk tolerance, and recognise that losses can occur quickly.