

Arm Holdings stock forecast: Haas flags AI demand
Arm Holdings is a UK-based semiconductor company. Chief executive Rene Haas said AI and data-centre demand showed no signs of slowing. Explore third-party ARM price targets and technical analysis. Past performance is not a reliable indicator of future results.
Arm Holdings plc (ARM) had a last price of $258.34 at 11:15am UTC on 8 September 2026. Earlier quote data showed prices between $241.95–$258.47, following a pullback from an August peak of $260.99. Past performance is not a reliable indicator of future results.
Attention has also turned to Arm's 9 September annual meeting, where shareholders are due to vote on a proposed remuneration plan for chief executive Rene Haas. ISS and Glass Lewis have recommended voting against the scheme, which could award Haas up to $800m in shares if Arm reaches specified valuation thresholds. SoftBank owns around 86% of Arm, making rejection less likely (The Telegraph, 31 August 2026).
Third-party ARM outlook: AI demand in focus
As of 8 September 2026, third-party Arm Holdings stock predictions show a wide range of 12-month targets, reflecting different assumptions around AI-related royalty growth, earnings and valuation.
TradingView (consensus overview)
TradingView reports an average 12-month target of $290.52 as of 15 August 2026, up from $288.33, based on estimates from 35 analysts. The average was around 4% above the 14 August closing price, with forecasts ranging from $130–$480 (TradingView, 15 August 2026).
TS2.tech (consensus overview)
TS2.tech reports an average Wall Street target of $301.06, around 20.1% above ARM's $250.72 reference close. Individual estimates range from $150 at Goldman Sachs to $500 at Mizuho Securities (TS2.tech, 20 August 2026).
Raymond James (individual house view)
Price Target reports that Raymond James raised its ARM target to $641 from $565 while maintaining an outperform rating. This sits well above the consensus ranges reported by the other sources reviewed here (Price Target, 25 August 2026).
MarketBeat (consensus overview)
MarketBeat reports a consensus target of $305.12 under a moderate buy rating as of 27 August, with analyst projections cited in the previous week ranging from $280–$350 (MarketBeat, 27 August 2026).
Barron's (consensus overview)
Barron's reports an average 12-month target of $297.63 as of 4 September, with estimates ranging from $130–$480. The average was around 22.7% above the $242.59 reference price cited alongside the forecast (Barron's, 4 September 2026).
Predictions and third-party forecasts are inherently uncertain, as they cannot fully account for unexpected market developments. Past performance is not a reliable indicator of future results.
Arm Holdings earnings: latest results and next report
Arm Holdings reported first-quarter fiscal 2027 results on 29 July 2026. Revenue reached $1.29bn, up 22.4% year on year, with royalty revenue of $715m exceeding licensing revenue for the period. Earnings per share came in at $0.45 (ARM Investor Relations, 29 July 2026).
ARM has not confirmed its next earnings date. Based on previous reporting patterns, second-quarter fiscal 2027 results are estimated for 4 November 2026 after market close (Zacks, 7 September 2026).
Past performance is not a reliable indicator of future results.
ARM stock price: technical overview
The ARM stock price trades above its 20- and 200-day simple moving averages (SMAs), near $253 and $202, but below its 50- and 100-day SMAs around $274 and $278, respectively. The 20-day SMA remains below the 50- and 100-day averages, while the 200-day exponential moving average (EMA) sits near $225, according to TradingView.
The 14-day relative strength index (RSI) reads 47.95, within neutral territory. The average directional index (ADX) stands at 9.47, indicating weak trend strength by conventional thresholds.
TradingView's classic pivot levels place the central pivot at $253.53, R1 at $287.67 and R2 at $333.42. The 200-day SMA near $202 provides a more distant reference below the last price. These levels describe the technical picture rather than indicating future direction (TradingView, 8 September 2026).
This is technical analysis for informational purposes only and does not constitute financial advice or a recommendation to buy or sell any instrument.
Arm Holdings share price history (2024–2026)
Arm Holdings listed on Nasdaq in September 2023. From a low of $79.04 in early April 2025, during tariff-driven market volatility, shares moved higher through 2025 and into 2026 as AI infrastructure spending remained in focus.
ARM’s stock price reached a two-year high of $445.05 on 22 June 2026 before declining through the summer. Shares fell to $201.32 on 29 July around the company's earnings period, then recovered through August as AI-related semiconductor demand remained a market theme.
More recently, ARM traded at $242.43 on 3 September. At 11:15am UTC on 8 September 2026, the last price was $258.34, around 124.5% higher year to date and 85.3% above the $139.41 close recorded on 8 September 2025.

Past performance is not a reliable indicator of future results. Share prices are indicative and may differ from live market prices.
Arm Holdings (ARM): Capital.com analyst view
Arm Holdings shares have moved through a wide range in 2026, reaching $445.05 in June before retreating through the summer. The period has coincided with continued attention on AI infrastructure spending, semiconductor demand and company-specific developments (BBC, 7 September 2026).
AI-related demand could support royalty growth if it drives wider adoption of ARM-based technology (BBC, 7 September 2026). Conversely, slower adoption or earnings that fall short of expectations could put pressure on the shares, particularly given the valuation assumptions reflected in some analyst forecasts (Barron's, 4 September 2026). Semiconductor-sector sentiment and company developments, including earnings and insider transactions, may also influence the price in either direction (MarketBeat, 7 September 2026).
Capital.com’s client sentiment for Arm Holdings CFDs
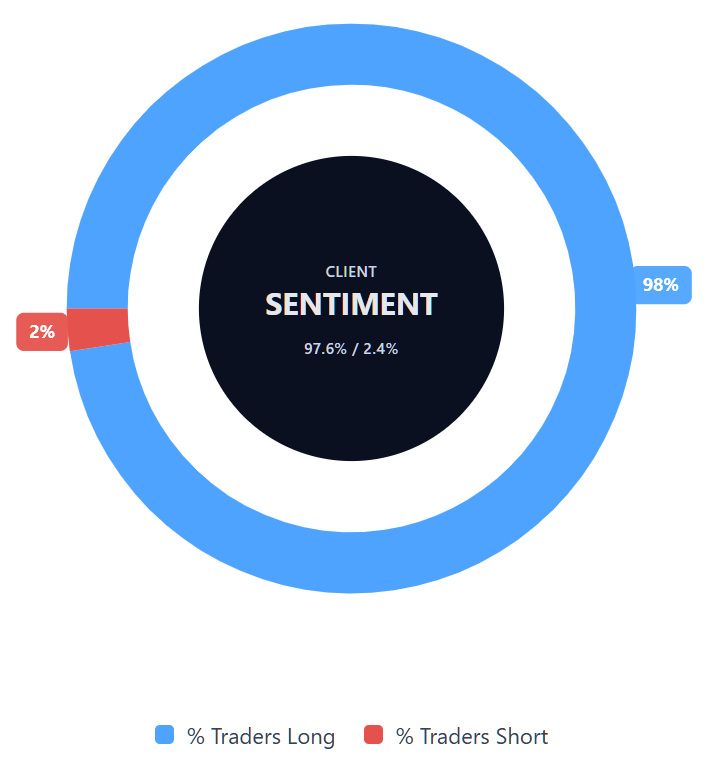
As of 8 September 2026, Capital.com client positioning in Arm Holdings CFDs is 97.6% long and 2.4% short, a difference of 95.2 percentage points. This snapshot reflects open positions on Capital.com and can change.
Summary – Arm Holdings 2026
- Current price: ARM had a last price of $258.34 at 11:15am UTC on 8 September 2026, with earlier quote data showing prices between $241.95–$258.47.
- Technical picture: ARM was above its 20- and 200-day SMAs but below its 50- and 100-day averages, with RSI neutral and ADX indicating weak trend strength.
- Key influences: AI-related demand, semiconductor-sector sentiment, earnings and valuation expectations could affect the shares in either direction.
- Recent developments: attention has centred on chief executive commentary on AI demand, first-quarter fiscal 2027 results and an insider share sale.
Past performance is not a reliable indicator of future results.
FAQ
Who owns the most Arm Holdings stock?
What is the five-year Arm Holdings share price forecast?
Is Arm Holdings a good stock to buy?
Could Arm Holdings stock go up or down?
Should I invest in Arm Holdings stock?
Can I trade Arm Holdings CFDs on Capital.com?
Yes, you can trade Arm Holdings CFDs on Capital.com. Trading share CFDs lets you speculate on price movements without owning the underlying asset and to take long or short positions. However, contracts for difference (CFDs) are traded on margin, and leverage amplifies both profits and losses. You should ensure you understand how CFD trading works, assess your risk tolerance, and recognise that losses can occur quickly.