
Chainlink price prediction: S&P partnership expansion
Chainlink (LINK) is a decentralised oracle network that expanded its collaboration with S&P Global Ratings in October 2026 to bring Vault Risk Assessment data onchain. Explore third-party LINK price targets and technical analysis. Past performance is not a reliable indicator of future results.
Chainlink (LINK/USD) trades at $11.24 as of 11:14am UTC on 2 November 2026, down from the session’s $11.84 intraday high and near its $11.24 low. Past performance is not a reliable indicator of future results.
On 28 October 2026, Chainlink expanded its collaboration with S&P Global Ratings to bring Vault Risk Assessment data onchain, giving institutions and DeFi platforms access to independent assessments of credit, liquidity and security risks in blockchain lending vaults (Yahoo Finance, 28 October 2026).
Chainlink also launched CustodySync with Anchorage Digital, allowing institutions to use assets held in custody as collateral in decentralised finance (DeFi) lending markets (Chainlink, 26 October 2026).
Meanwhile, broader crypto markets faced volatility following Binance's reported $6.3bn security breach in late October (Reuters, 29 October 2026).
Third-party LINK outlooks: 2026–2030
As of 2 November 2026, third-party LINK price predictions include model-based estimates, scenario ranges and a conditional analyst outlook. These forecasts do not represent a broker consensus or investment recommendations.
Chainlink price prediction 2026
- Cryptopolitan projects a 2026 average Chainlink price of $11.38, within a range of $7–$17 (Cryptopolitan, 2 November 2026).
- Crypto News puts LINK's December 2026 base-case estimate at $13.28, with bearish and bullish scenarios of $11.28 and $15.93 respectively (crypto.news, 2 November 2026).
- CryptoTicker projects a 2026 average price of $14.08, within a scenario range of $9.38–$20.11 (CryptoTicker, 1 November 2026).
- CoinCodex forecasts an average 2026 LINK price of $12.91, with a range of $11.09–$15.05 (CoinCodex, 2 November 2026).
- Coinpedia reports that analyst Michaël van de Poppe sees potential for LINK to trade above $20 in the first quarter of 2027, provided it closes the week above $10.60 (Coinpedia, 2 November 2026).
Chainlink price prediction 2027
- Cryptopolitan forecasts a 2027 average price of $13.02, within a range of $8.01–$19.46 (Cryptopolitan, 2 November 2026).
- Crypto News projects a 2027 base-case price of $15.19, with bearish and bullish scenarios of $10.63 and $21.26 respectively (crypto.news, 2 November 2026).
- CryptoTicker estimates a 2027 average LINK price of $16.20, within a range of $7.03–$31.17, using fixed annual growth assumptions (CryptoTicker, 1 November 2026).
- CoinCodex forecasts an average 2027 LINK price of $23.93, with a range of $12.76–$34.46 (CoinCodex, 2 November 2026).
- CoinDataFlow forecasts a 2027 trading range of $7.43–$20.30, with an average price of $13.87, using a model based on Bitcoin's four-year cycle (CoinDataFlow, 1 November 2026).
Chainlink price prediction 2030
- Cryptopolitan projects a 2030 average price of $24.57, within a range of $15.10–$36.68 (Cryptopolitan, 2 November 2026).
- Crypto News models a 2030 base-case price of $36, with bearish and bullish scenarios of $25.20 and $50.40 respectively (crypto.news, 2 November 2026).
- CryptoTicker forecasts a 2030 average LINK price of $20.95, within a range of $3.35–$79.33 (CryptoTicker, 1 November 2026).
- CoinCodex forecasts an average 2030 LINK price of $22.09, with a range of $15.55–$31.32 (CoinCodex, 2 November 2026).
- CoinDataFlow projects a range of $22.61–$83.94, with an average price of $53.28, using cycle-based modelling (CoinDataFlow, 1 November 2026).
Predictions and third-party forecasts are inherently uncertain, as they cannot fully account for unexpected market developments. Past performance is not a reliable indicator of future results.
Is Chainlink a good investment? Third-party analyst views
Third-party views on LINK as an investment are mixed:
- Charles Schwab: LINK may offer exposure to growing links between traditional finance and blockchain, but faces volatility, competition and regulatory uncertainty. Greater network adoption may not increase demand for LINK (Charles Schwab, 20 October 2026).
- 24/7 Wall St.: Considers a move above $20 unlikely by the end of 2026, with a modest chance by the end of 2027. LINK would first need to clear its 50-day moving average at $12.62, followed by $15 (24/7 Wall St., 31 October 2026).
- Coin Bureau: LINK's circulating supply continues to increase, while growth in Chainlink's infrastructure usage may outpace demand for the token (Coin Bureau, 4 October 2026).
Third-party views are not investment recommendations. Whether LINK is suitable depends on your circumstances, objectives and risk tolerance. Past performance is not a reliable indicator of future results.
Chainlink technical analysis
The LINK/USD price trades at $11.24 as of 11:14am UTC on 2 November 2026, above its 200-day simple moving average (SMA) near $10. The 20-, 50-, 100- and 200-day SMAs stand at roughly $12, $13, $11 and $10 respectively, with the 20-day average below the 50-day average.
The 14-day relative strength index (RSI) reads 41.7, within neutral territory, while the average directional index (ADX) at 26.5 indicates an established trend without specifying its direction. The moving average convergence divergence (MACD) level is negative at −0.40, while the fast stochastic RSI at 76.11 sits in the upper part of its range, contrasting with the bear power reading of −0.54.
Above the current price, $12 and the classic pivot at $12.19 form the nearest technical levels, followed by $13 and first pivot resistance (R1) at $14.10. R2 stands at $16.56.
Below the current price, the 100-day SMA and 200-day exponential moving average (EMA) sit near $11. Further down, the 200-day SMA stands around $10, followed by first pivot support (S1) at $9.73 (TradingView, 2 November 2026).
This is technical analysis for informational purposes only and does not constitute financial advice or a recommendation to buy or sell any instrument.
Chainlink CFD price history (2024–2026)
LINK/USD’s CFD price started November 2024 around $11.12, trading between roughly $10.50 and $11.70 in the early days. LINK rose to $15.30 by mid-November before rising higher in December, closing at $29.31 on 15 December and trading near $31 shortly afterwards.
Chainlink closed at $21.73 on 1 January 2025 before falling to $14.08 by early April. A rebound took LINK to $15.48 in early June, although the token subsequently declined, reaching $7.37 by 1 July 2026.
LINK rose to $14.42 by early October 2026 before falling back through the month. It closed at $11.41 on 1 November and traded at $11.24 as of 11:14am UTC the following day.

Past performance is not a reliable indicator of future results. Prices are indicative and may differ from live market prices.
Latest Chainlink news and market context
S&P Vault Risk Assessment
Chainlink announced an expanded collaboration with S&P Global Ratings on 28 October 2026, bringing S&P’s Vault Risk Assessment data onchain through Chainlink DataLink and the Chainlink Runtime Environment. The integration builds on an existing relationship that brought Stablecoin Stability Assessments onchain, giving institutions access to independent risk assessments through blockchain networks (Yahoo Finance, 28 October 2026).
CustodySynch announcement
On 26 October 2026, Chainlink launched CustodySync with Anchorage Digital as its initial partner. The service allows institutions to borrow against assets held in custody through DeFi lending markets, without transferring those assets out of custody (Chainlink, 26 October 2026).
Chainlink feeds and streams on Stellar mainnet
Chainlink’s Data Feeds and Data Streams were announced as live on Stellar’s mainnet on 14 October 2026, providing market data to developers across a network supporting more than $4bn in tokenised real-world assets. The Stellar Development Foundation is supporting the integration through the Chainlink Scale programme (Stellar Development Foundation, 14 October 2026).stellar
$6.3bn Binance cyberattack
Broader crypto markets saw volatility following Binance's disclosure of a $6.3bn security breach in late October (Reuters, 30 October 2026). Bitcoin traded around $78,076 on 2 November, while Ethereum stood near $2,300, as markets responded to the incident (Yahoo Finance, 2 November 2026).
Capital.com analyst view: Chainlink
Greater use of Chainlink's data and custody services could increase network activity, although this would not necessarily translate into greater demand for LINK. Broader cryptocurrency market conditions could also influence its price, with improving sentiment potentially providing support, while weaker demand or further security concerns could weigh on it. Past price movements do not reliably indicate future performance.
Capital.com’s client sentiment for Chainlink CFDs
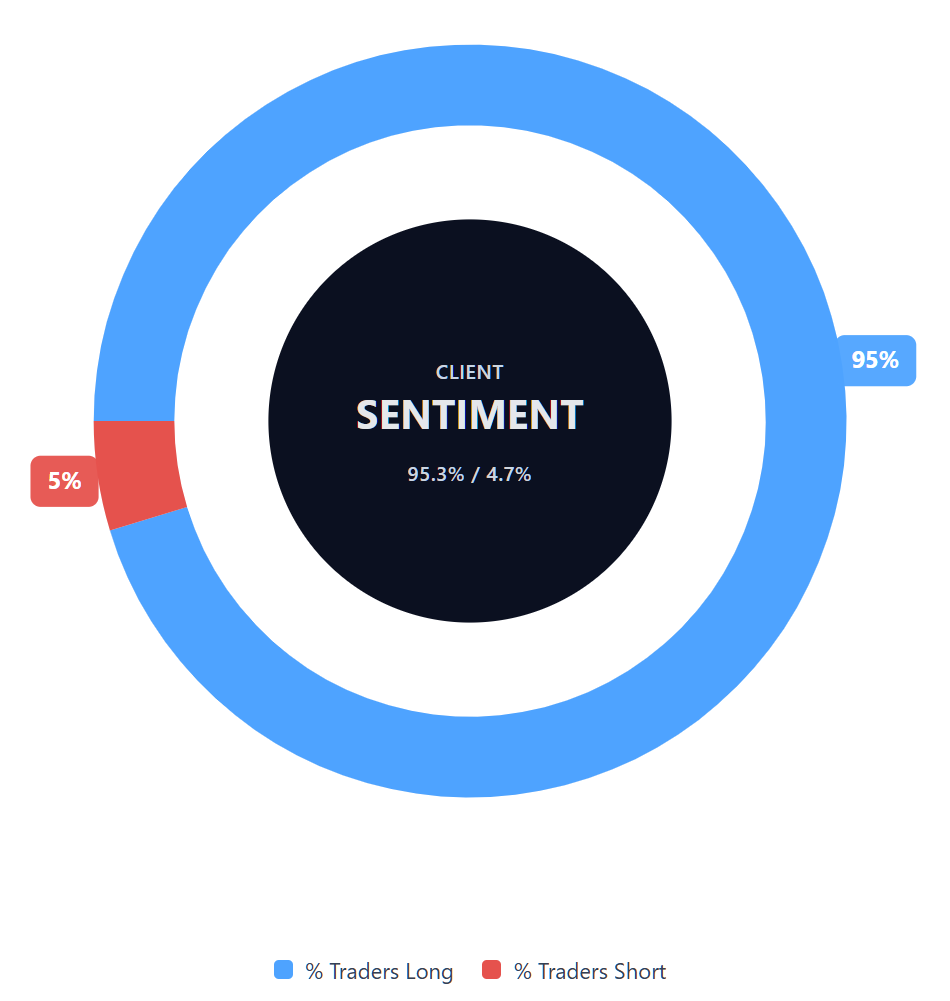
As of 2 November 2026, Capital.com client positioning in Chainlink CFDs stands at 95.3% buyers versus 4.7% sellers, a difference of 90.6 percentage points in favour of buyers. This snapshot reflects open positions on Capital.com and can change. It doesn't indicate future price direction.
Summary – Chainlink (2026)
- Chainlink CFDs traded around $11.24 on Capital.com, within an intraday range of $11.24–$11.84, near the session low, as of 11:14am UTC on 2 November 2026.
- According to TradingView data, LINK traded below its 20- and 50-day SMAs but above its 200-day average, while momentum indicators showed differing signals.
- Recent news includes Chainlink’s expanded S&P Global Ratings collaboration and CustodySync launch with Anchorage Digital, alongside broader cryptocurrency market volatility following the Binance security breach
Past performance is not a reliable indicator of future results.