CFDs are complex instruments and come with a high risk of losing money rapidly due to leverage. 85.24% of retail investor accounts lose money when trading CFDs with this provider. You should consider whether you understand how CFDs work and whether you can afford to take the high risk of losing your money
887.16
0.3%
Market Trading Hours* (UTC) Opens on Wednesday at 13:30

Mon - Thu: 13:30 - 20:00

  • Summary
  • Historical Data
Trading сonditions
Spread 5.16
Long position overnight fee

Long position overnight funding adjustment


Margin. Your investment $1,000.00
Overnight funding adjustment -0.023457 %
Charges from full value of position ($-4.46)
Trade size with leverage ~ $20,000.00
Money from leverage ~ $19,000.00

Go to platform
-0.023457%
Short position overnight fee

Short position overnight funding adjustment


Margin. Your investment $1,000.00
Overnight funding adjustment 0.001235 %
Charges from full value of position ($0.23)
Trade size with leverage ~ $20,000.00
Money from leverage ~ $19,000.00

Go to platform
0.001235%
Overnight fee time 21:00 (UTC)
Min traded quantity 0.01
Currency USD
Margin 5.00%
Stock exchange United States of America
Commission on trade 0%

Key Stats
Prev. Close 889.85
Open 883.41
1-Year Change 15.79%
Day's Range 883.41 - 898.16
  • Last Week
  • Last Month
  • Last Year
  • Last two Years
  • Max
  • Daily
  • Weekly
  • Monthly
Date Close Change Change (%) Open High Low
Apr 14, 2025 889.85 -0.52 -0.06% 890.37 899.44 878.82
Apr 11, 2025 875.45 27.33 3.22% 848.12 887.45 840.23
Apr 10, 2025 857.98 -16.97 -1.94% 874.95 878.78 824.95
Apr 9, 2025 892.64 92.17 11.51% 800.47 903.31 792.67
Apr 8, 2025 813.21 -32.88 -3.89% 846.09 854.02 802.70
Apr 7, 2025 817.68 27.72 3.51% 789.96 845.50 771.68
Apr 4, 2025 809.95 -44.00 -5.15% 853.95 858.50 809.26
Apr 3, 2025 885.84 -34.12 -3.71% 919.96 923.11 885.19
Apr 2, 2025 959.10 25.39 2.72% 933.71 965.59 932.90
Apr 1, 2025 943.75 1.80 0.19% 941.95 955.95 928.76
Mar 31, 2025 945.71 12.32 1.32% 933.39 949.01 920.34
Mar 28, 2025 944.95 -13.19 -1.38% 958.14 967.95 944.95
Mar 27, 2025 963.91 0.27 0.03% 963.64 974.95 950.22
Mar 26, 2025 966.47 -8.44 -0.87% 974.91 978.33 963.35
Mar 25, 2025 971.06 4.11 0.43% 966.95 976.55 960.95
Mar 24, 2025 961.00 0.60 0.06% 960.40 970.74 954.95
Mar 21, 2025 947.66 4.83 0.51% 942.83 954.64 935.26
Mar 20, 2025 952.06 0.66 0.07% 951.40 960.47 945.83
Mar 19, 2025 956.62 -2.28 -0.24% 958.90 964.79 950.65
Mar 18, 2025 954.95 -0.95 -0.10% 955.90 964.00 954.95

Trading calculator

Calculate your hypothetical P&L if you had opened a CFD trade on a certain date (select a date) and closed on a different date (select a date).

Trade commission
0
  • 1:1
  • 2:1
  • 3:1
  • 5:1
  • 10:1
  • 20:1
Leverage
20:1
  • 20
  • 100
  • 500
  • 1000
  • 10000
Investment
Trade size (Leverage x Investement):
Open

Close

Short Long

For the avoidance of doubt, this calculation does not include the costs of holding a position overnight (for which there will be additional charges)

BlackRock Company profile

BlackRock (BLK) is a provider of investment, advisory and risk-management solutions. 

Founded in 1988, BlackRock’s headquarters are in New York. The company operates through 89 offices in 38 countries in North America, South America, Europe, The Middle East, Africa and Asia-Pacific. 

The company offers services to individuals and families, financial advisors, pension planners, educational and nonprofit organizations, and governments. BlackRock manages separate portfolios, focusing on equity, fixed income, balanced baskets, currency, commodity and multi-asset exchange-traded funds (ETF) for clients. 

Additionally, BlackRock benchmarks its portfolio to leading indexes globally, such as the S&P Global, Russell, Merrill Lynch indices and MSCI. The company acquired Merrill Lynch Investment Management in 2006. In 2009, Blackrock acquired Barclays Global Investors (BGI). In 2018, it acquired eFront.

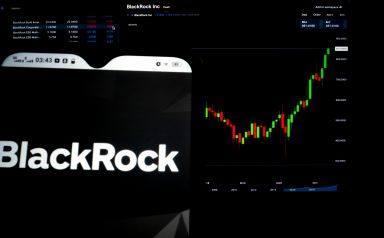
BlackRock Inc. stock began trading on the New York Stock Exchange (NYSE) in 1999 under the ticker symbol BLK. You can track live BLK share value and price history at Capital.com.

Industry: Investment Management & Fund Operators (NEC)

50 Hudson Yards
NEW YORK
NEW YORK 10001
US

People also watch

ETH/USD

1,600.32 Price
-2.170% 1D Chg, %
Long position overnight fee -0.0616%
Short position overnight fee 0.0137%
Overnight fee time 21:00 (UTC)
Spread 1.75

BTC/USD

83,753.90 Price
-1.320% 1D Chg, %
Long position overnight fee -0.0616%
Short position overnight fee 0.0137%
Overnight fee time 21:00 (UTC)
Spread 50.00

US100

18,566.50 Price
-1.080% 1D Chg, %
Long position overnight fee -0.0235%
Short position overnight fee 0.0012%
Overnight fee time 21:00 (UTC)
Spread 1.8

XRP/USD

2.09 Price
-2.890% 1D Chg, %
Long position overnight fee -0.0616%
Short position overnight fee 0.0137%
Overnight fee time 21:00 (UTC)
Spread 0.01042

Still looking for a broker you can trust?

Join the 720,000+ traders worldwide that chose to trade with Capital.com

1. Create & verify your account 2. Make your first deposit 3. You’re all set. Start trading