
Crude oil price forecast: US-Iran strikes, Hormuz supply risk
US Crude and Brent crude prices rose after fresh US-Iran strikes renewed concerns over tanker traffic through the Strait of Hormuz, a key route for global oil supply. Explore third-party crude oiL price targets and technical analysis. Past performance is not a reliable indicator of future results.
US Crude Oil (US Crude) is trading near $87.95 as of 14:04 UTC on 2 September 2026, within its intraday range of $85.42–$90.71, while Brent Crude Oil (Brent Crude) is trading near $93.28, within its intraday range of $90.41–$95.99. Past performance is not a reliable indicator of future results.
Prices remain above recent levels after fresh US-Iran military strikes raised concerns about potential disruption to tanker traffic through the Strait of Hormuz, a key artery for global crude flows (Reuters, 2 September 2026) l, according to Reuters. Meanwhile, Brent crude settled at a five-week high in the prior session, gaining more than $4 a barrel (Reuters, 1 September 2026). Past or simulated performance is not a reliable indicator of future results, and prices can move quickly amid geopolitical developments.
Crude oil price forecast (third-party price targets): Hormuz supply risks return
As of 2 September 2026, third-party crude oil predictions reflect differing views on Strait of Hormuz normalisation, OPEC+ supply decisions and the market balance into 2027. Together, they show how supply risks and softer demand expectations are shaping the outlook across both benchmarks.
Reuters poll (US Crude, consensus survey)
Reuters reports that a poll of 31 economists and analysts puts the average 2026 forecast for US crude at $80.20 per barrel, broadly unchanged from the July estimate of $80.14. The survey attributes the steady outlook to shipping disruptions linked to the US-Iran conflict offsetting weaker Chinese import demand (Reuters, 31 August 2026).
Goldman Sachs (US Crude, desk target)
Goldman Sachs maintains a WTI target of $83 per barrel for December 2026, according to a panel of nine institutional bank desks tracking oil forecasts. The estimate sits above the panel median of $66 per barrel, placing Goldman towards the higher end of the range amid continued uncertainty over Strait of Hormuz supply (FX Bank Forecast, 25 August 2026).
Wall Street Journal survey (US Crude, consensus survey)
The Wall Street Journal's survey of forecasters puts the 2026 average WTI price at $78.79 per barrel, down from a July projection of $79.73. The publication attributes the reduction to expectations of softer global demand growth offsetting continued Middle East supply risk, according to results reported on 31 August 2026 (TradingView, 31 August 2026).
Citi (Brent Crude, quarterly forecast)
Citi raises its third-quarter 2026 average Brent forecast to $80 per barrel from $75, while maintaining its fourth-quarter 2026 and full-year 2027 forecasts at $70 and $65 per barrel, respectively. The bank cites continued uncertainty around US-Iran dealmaking as the basis for the near-term revision (Reuters, 7 August 2026).
Morgan Stanley (Brent Crude, quarterly forecast)
Morgan Stanley raises its Brent forecasts to $90 per barrel for the third quarter of 2026, $100 for the fourth quarter, $95 for the first quarter of 2027 and $90 for the second quarter of 2027, up from a previous flat assumption of $75 across all four periods. The bank cites a slower-than-expected Middle East supply recovery, which it says could leave the market in deficit through the fourth quarter of 2026 and first quarter of 2027 (BOE Report, 24 August 2026).
Predictions and third-party forecasts are inherently uncertain, as they cannot fully account for unexpected market developments. Past performance is not a reliable indicator of future results.
Crude oil: macro data and sector developments
Market attention over the coming week is likely to remain focused on developments around the Strait of Hormuz, after CENTCOM confirmed fresh strikes on Iranian military targets on 1 September 2026, followed by Iranian missile and drone retaliation against US allies in the Gulf, according to the Associated Press (AP, 2 September 2026). The exchange marked the first direct military confrontation between the two sides in a month, following a similar pause earlier in the six-month conflict, keeping regional supply and tanker traffic under scrutiny (AP, 2 September 2026).
Scheduled market data will provide another point of focus. The US Energy Information Administration is due to publish its weekly crude oil inventories report on 2 September 2026, offering an updated view of changes in US crude stocks and domestic supply-demand conditions (Investing.com, 2 September 2026).
Further ahead, OPEC and non-OPEC members are scheduled to hold a ministerial meeting on 6 September 2026, followed by OPEC's Monthly Oil Market Report on 10 September 2026. Together, these events may provide further detail on production policy and the organisation's assessment of global oil market conditions (Trading Economics, 2 September 2026).
Against this backdrop, tanker traffic and reports of shipping disruption in the Strait of Hormuz are likely to remain closely watched, given the route's importance to global seaborne crude flows. Past or simulated performance is not a reliable indicator of future results, and prices can move quickly in response to scheduled data and unscheduled geopolitical developments.
Crude oil prices: technical overview
US Crude Oil (WTI)
As of 2:04pm UTC on 2 September 2026, US Crude’s price is above its 20/50/100/200-day simple moving averages (SMAs) at roughly 84 / 80 / 86 / 78, though the averages are mixed rather than aligned in a single direction, with the price sitting between the shorter-term averages and the 100-day SMA near 86. The 20-day SMA remains above the 50-day SMA, while the 10-day exponential moving average (EMA) near 86 and Hull moving average near 89 remain close to the current price.The 14-day relative strength index (RSI) stands at 62.34, while the 14-day average directional index (ADX) is 15.34. This places RSI above the midpoint of its range, while the relatively low ADX suggests the trend itself remains limited in strength. The next technical reference point above the current price is the R1 pivot near 90.89. A daily close above this level would place the R2 zone near 96.01 above the market as the next pivot reference.On pullbacks, the classic pivot near 82.56 marks the first reference level below the current price, with the 200-day SMA near 78.35 forming a deeper moving-average level. A sustained move below that level would place the S2 area near 69 further below the market (TradingView, 2 September 2026).
Brent Crude Oil
As of 2:04pm UTC on 2 September 2026, Brent Crude’s price is above its 20/50/100/200-day SMAs at roughly 89 / 85 / 91 / 83, although the price remains just below the 100-day SMA near 91. The 20-day SMA remains above the 50-day SMA, and the 10-day EMA near 91 is also close to the current price.The 14-day RSI stands at 59.96, while the 14-day ADX is 17.60, again showing momentum above the midpoint while trend strength remains relatively limited. The nearest pivot reference above the current price is R1 near 97.51. A daily close above this level would place the R2 zone near 104.53 above the market as the next pivot reference.On the downside, the classic pivot near 87.81 marks the first reference level below the current price, with the 200-day SMA near 83.30 forming the next moving-average level. A sustained move below that level would place the S2 area near 71 further below the market (TradingView, 2 September 2026).
Crude oil price history (2024–2026)
US Crude and Brent Crude have experienced sizeable price movements over the past two years, shaped largely by shifting Middle East supply risk and changes in OPEC+ output policy. Both benchmarks followed broadly similar paths, although the scale and timing of individual moves differed.
US Crude Oil (WTI)
The US Crude price started September 2024 trading around $69.91 and spent much of that autumn and winter between the high-$50s and low-$70s as demand concerns weighed on the market. The price fell to a 2025 low near $55.76 on 4 May 2025 before climbing back through the summer, briefly moving above $75 in late June amid regional supply concerns.
Prices then rose substantially into 2026, with US Crude reaching an intraday high of $115.78 on 9 March 2026 as fresh Middle East tensions disrupted supply expectations. The price subsequently moved back into the $70s and $80s through the spring and summer as those tensions partially unwound. US Crude closed at $88.03 on 2 September 2026, around 34.6% higher year on year and 25.9% higher than two years earlier.

Past performance is not a reliable indicator of future results. Prices are indicative and may differ from live market prices.
Brent Crude Oil
The Brent Crude price followed a broadly similar path, trading in the high-$60s through late 2025 as global supply remained ample and demand growth stayed muted. The benchmark then rose sharply in early 2026, reaching an intraday high of $116.29 on 9 March 2026 as the same Middle East supply disruption that lifted WTI also affected Brent prices.
Brent declined through the second quarter of 2026 before rising again into late summer amid renewed supply concerns tied to the Strait of Hormuz. Brent Crude closed at $93.36 on 2 September 2026, around 35.1% higher year on year, compared with $69.08 on 2 September 2025.
Past performance is not a reliable indicator of future results. Prices are indicative and may differ from live market prices.
US Crude vs Brent Crude: Capital.com analyst outlook
US Crude and Brent Crude have both traded above their year-ago levels amid recurring Middle East supply disruptions, most recently linked to renewed US-Iran military action affecting Strait of Hormuz transit. Factors that may influence prices include the availability of physical supply and the level of OPEC+ spare capacity. Conversely, weaker demand signals from major importers such as China, alongside expectations of a growing global supply surplus into 2027 cited by several third-party forecasters, may place downward pressure on prices and offset some of the geopolitical risk premium reflected in both benchmarks.
Both crude benchmarks have also recorded large intraday price movements during periods of geopolitical escalation, as reflected in the range between the current session's high and low. Such volatility can lead to rapid price moves in either direction, increasing both potential gains and potential losses for CFD traders. Prices may also reverse quickly if geopolitical tensions ease or diplomatic developments change supply expectations. The balance between these competing factors means the outlook remains sensitive to both geopolitical events and changes in underlying supply and demand. Past or simulated performance is not a reliable indicator of future results, and oil prices can be highly sensitive to unforeseen geopolitical and economic developments.
Capital.com’s client sentiment for crude oil CFDs
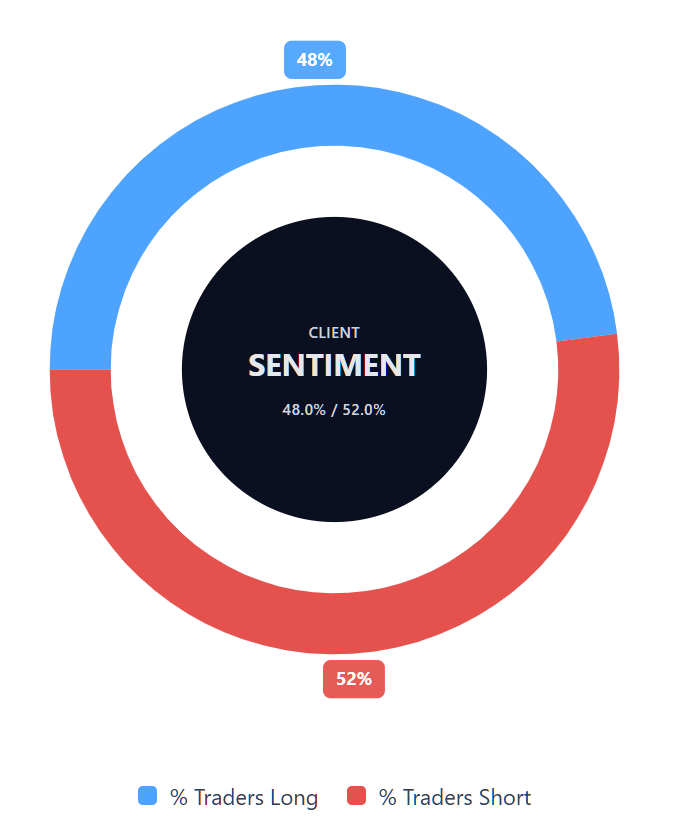
Client sentiment for US Crude CFDs
As of 2 September 2026, Capital.com client positioning in US Crude CFDs is broadly even, with 48% of clients long versus 52% short. This puts short positions ahead by four percentage points, indicating a relatively narrow difference between the two sides. The figures suggest positioning remains closely divided rather than concentrated in one direction. This snapshot reflects open positions on Capital.com and can change.
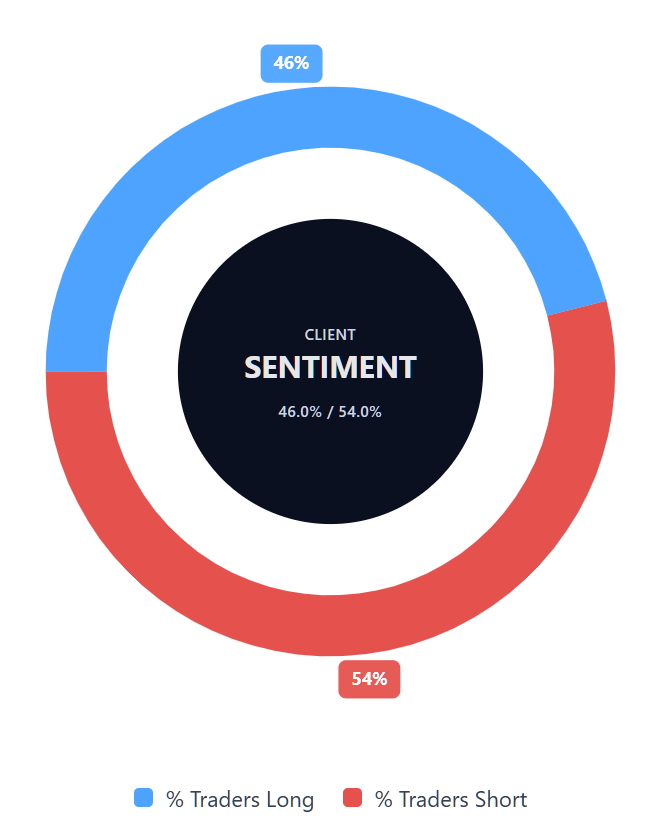
Client sentiment for Brent Crude CFDs
As of 2 September 2026, Capital.com client positioning in Brent Crude CFDs shows 46% of clients long and 54% short. Short positions therefore lead by eight percentage points, although neither side accounts for a large majority of positioning. As with US Crude, the data represents a point-in-time view rather than a directional indicator. This snapshot reflects open positions on Capital.com and can chang
Summary – US Crude and Brent Crude (2026)
- As of 2:04pm UTC on 2 September 2026, US Crude traded near $87.95 and Brent Crude near $93.28, both more than 34% higher year on year.
- According to TradingView data, technical indicators show both benchmarks above their 20/50-day moving averages, with RSI readings near 60 or above and ADX readings suggesting relatively limited trend strength.
- Key factors influencing the outlook include renewed US-Iran military action, Strait of Hormuz transit risk, OPEC+ supply decisions and expectations of a widening global supply surplus in 2027.
- Recent market developments include fresh Middle East strikes and multi-week highs in crude prices, alongside a wide range of analyst forecasts extending from the low $60s to around $100 per barrel.
Past performance is not a reliable indicator of future results.
FAQ
What is the US Crude and Brent Crude price forecast?
Third-party forecasts cited in this article show a wide range of expectations for US Crude (WTI) and Brent Crude through 2026 and into 2027. WTI estimates range from the low $60s to the mid-$80s per barrel, while Brent forecasts extend from around $60–$100 per barrel. These projections vary by institution, timeframe and assumptions about Middle East supply, OPEC+ output and global demand, and they may prove inaccurate.
What influences US Crude and Brent Crude prices?
US Crude and Brent Crude prices can respond to changes in global supply and demand, OPEC+ production policy, geopolitical developments and expectations for economic activity. In 2026, the Strait of Hormuz has been an important factor because disruption to tanker traffic can affect expectations for Middle East oil supply. Demand from major importers such as China, changes in inventories and expectations for future supply surpluses or deficits can also influence prices.
Could US Crude and Brent Crude prices go up or down?
Yes. Crude oil prices can move in either direction as market conditions change. Continued disruption to Middle East supply or tighter-than-expected production could contribute to higher prices, while weaker demand, recovering supply or expectations of a growing global surplus could place downward pressure on them. The forecasts covered in this article illustrate that uncertainty, with institutions reaching different conclusions based on their assumptions. Past performance is not a reliable indicator of future results.
Can I trade US Crude and Brent Crude CFDs on Capital.com?
Yes, you can trade US Crude CFDs and Brent Crude CFDs on Capital.com. Trading commodity CFDs lets you speculate on price movements without owning the underlying asset and to take long or short positions. However, contracts for difference (CFDs) are traded on margin, and leverage amplifies both profits and losses. You should ensure you understand how CFD trading works, assess your risk tolerance, and recognise that losses can occur quickly.