Stop-loss strategies: how and where to place a stop loss
A stop-loss order is a key tool for managing risk when trading CFDs. It lets you set a predefined loss level on a position, helping to limit potential downside in volatile markets.
Stop-loss orders are risk-management tools that help traders limit potential downside in volatile markets. This guide explains how stop-loss strategies work, where traders often place them, and what their limitations are.
Cutting losses short and letting winners run remains a key principle of trading and investing. The question that follows is: what is a stop-loss strategy and how can it help manage risk within a trading plan?
Below, we explore some of the most common stop-loss techniques, each suited to different trading styles and market conditions.
What is a stop loss?
A stop-loss order is an instruction placed with a broker to buy or sell an asset once it reaches a specified price. The aim is to limit losses if the market moves against your position.
For example:
- A stop loss on a long position is set below the entry price.
- A stop loss on a short position is set above the entry price.
This automated tool helps traders manage positions even when they are not actively monitoring the market.
Stop-loss strategies for CFD traders
The risk-per-trade approach
The risk-per-trade method focuses on protecting trading capital and is one of the simplest ways to apply a stop-loss strategy. By deciding the maximum amount of capital you’re willing to risk on a single trade, you can calculate where to place your stop loss to stay within that limit.
This approach supports consistent risk management, regardless of position size or market volatility.
The risk–reward strategy
The risk–reward ratio compares potential loss (risk) with potential gain (reward). It helps traders assess whether a trade offers a reasonable return relative to the amount at risk.
Setting stop losses and take-profit levels based on a defined risk–reward ratio can support more systematic, less emotional trading decisions. While no ratio guarantees success, maintaining consistency may help traders limit losses without capping potential profits excessively.
All trading involves risk. Past performance does not guarantee future results.
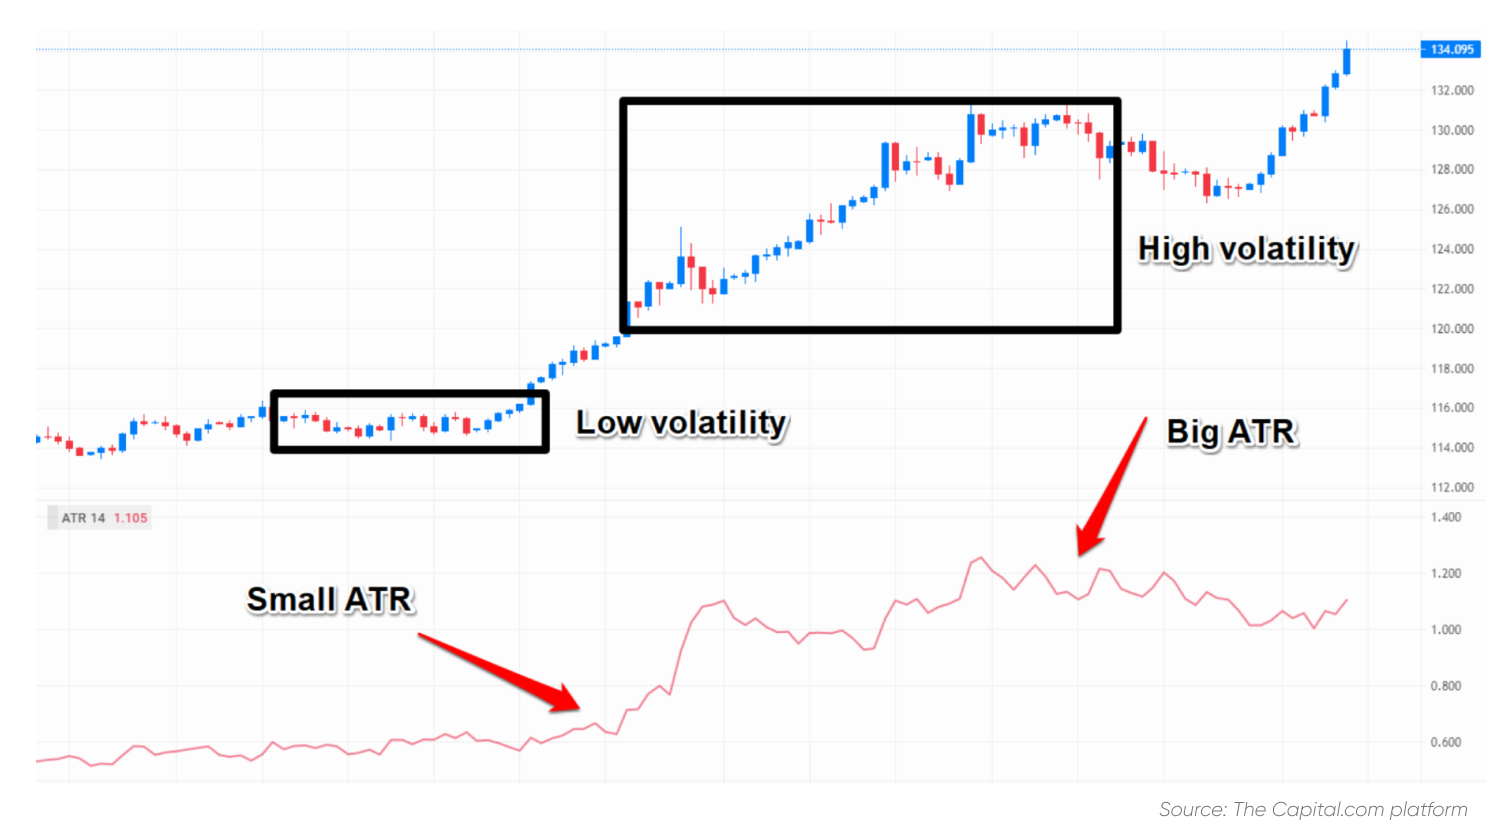
The volatility-based approach
Markets are rarely static. Prices fluctuate with market sentiment, data releases and economic events. A volatility-based stop-loss strategy adapts to these movements.
A common tool used in this method is the average true range (ATR) indicator, which measures average market volatility over a given period.
Past performance is not a reliable indicator of future results.
However, the ATR is a lagging indicator, meaning it reflects historical rather than future volatility.
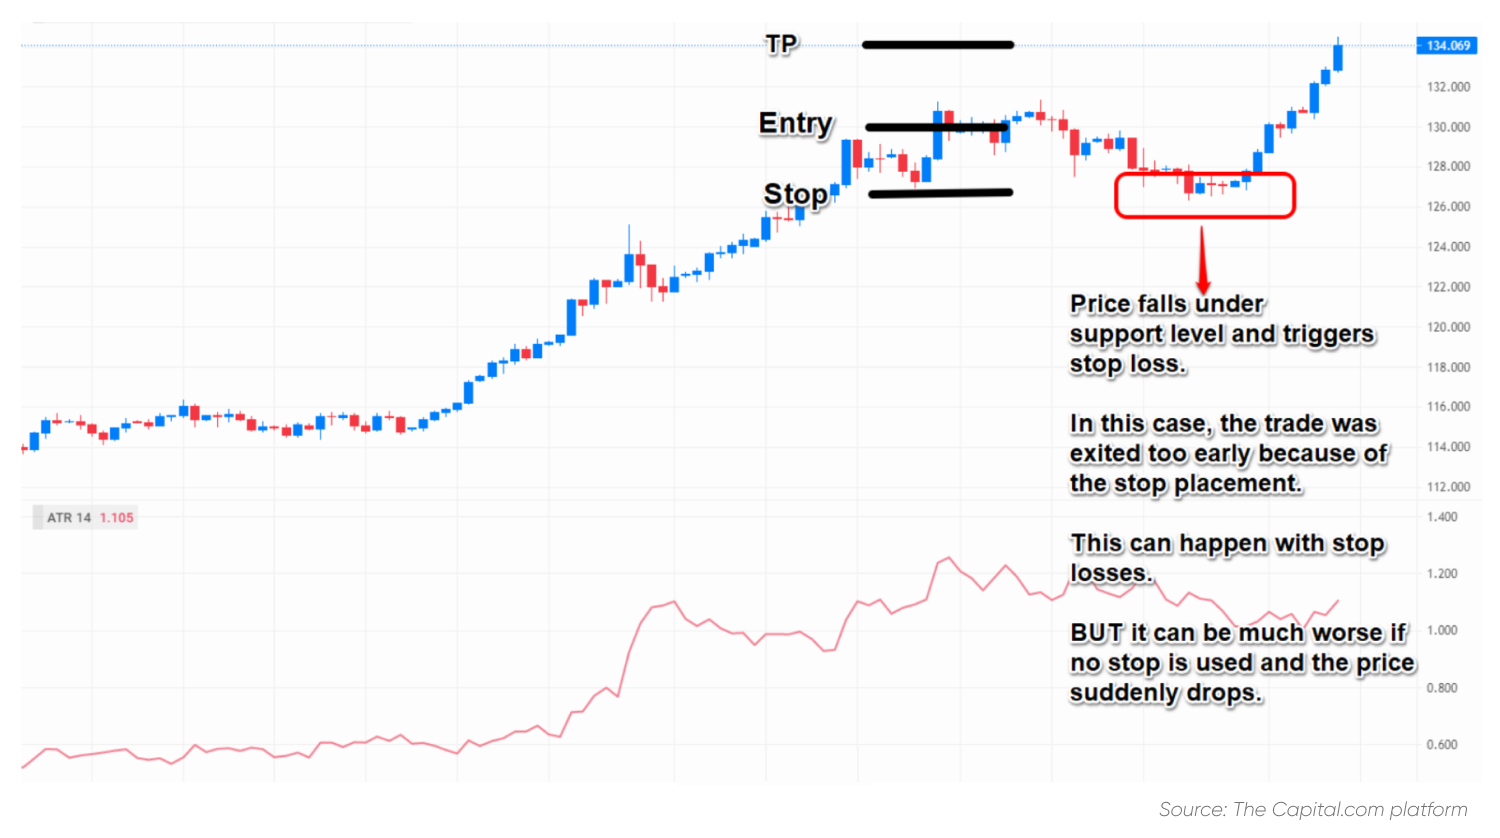
The support and resistance approach
Support and resistance (S/R) levels are central to technical analysis. Traders often use them to determine logical points for placing stop losses.
Support represents a level where price may find demand and stop falling; resistance indicates where price may face selling pressure and stop rising.
Past performance is not a reliable indicator of future results.
S/R levels can be identified using previous highs and lows, moving averages or Fibonacci retracements. However, while this approach is widely used, it requires interpretation and experience.
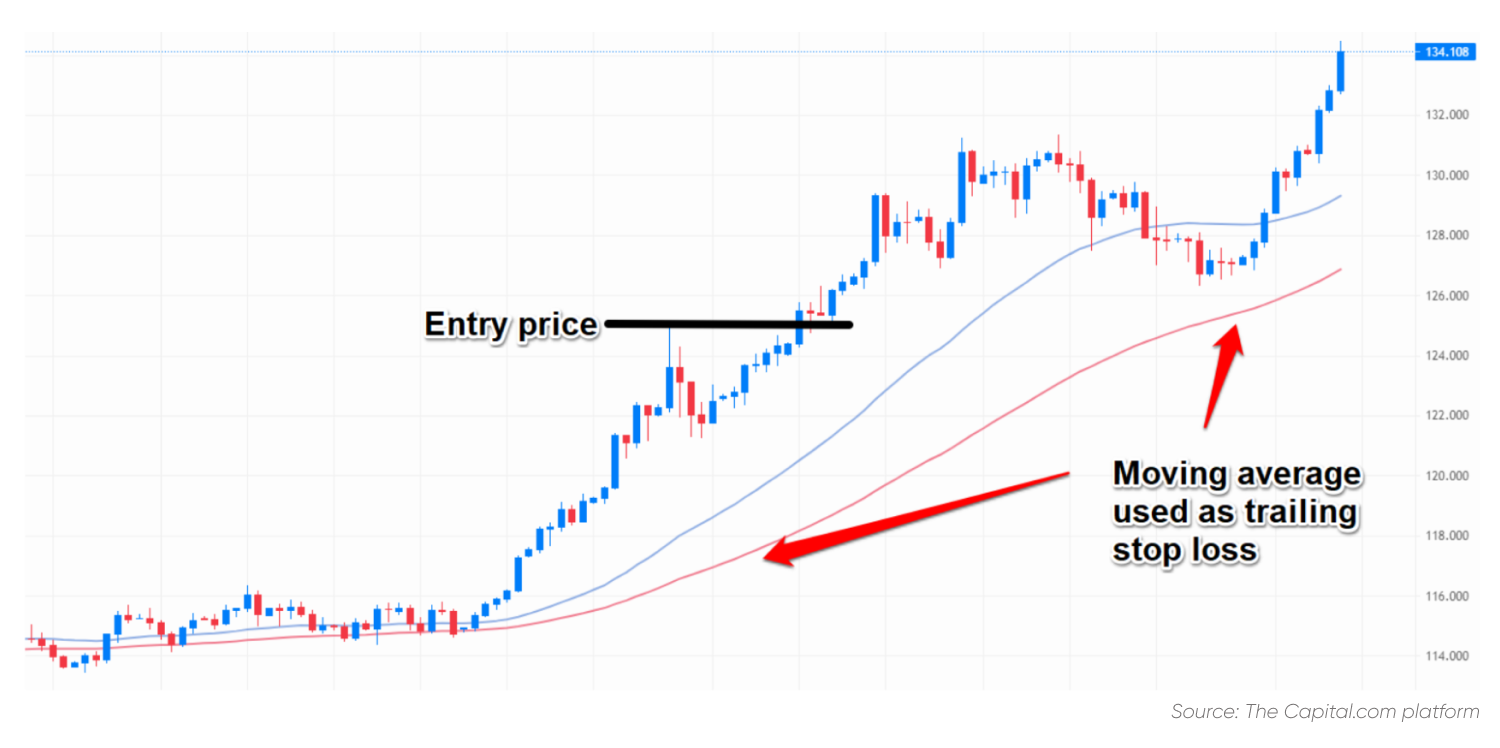
The trailing stop-loss strategy
A trailing stop loss automatically adjusts as the market moves in your favour. This dynamic approach helps lock in profits while maintaining downside protection.
Past performance is not a reliable indicator of future results.
Some traders use moving averages (for instance, the 50-day moving average) as a reference for trailing stops — allowing the stop loss to move higher in line with an uptrend.
Limitations of stop losses
Stop losses are useful, but they have limitations:
- No stop loss guarantees a fixed exit price, unless it’s a guaranteed stop order, which incurs an additional fee when activated.
- Stops set too close to the market price may lead to premature exits from normal fluctuations.
- Stops set too far away increase potential losses.
- High volatility can cause slippage, where the stop order executes at the next available price.
Stop-loss levels are visible to brokers and liquidity providers, but price movements that trigger stop clusters are generally driven by liquidity, not intent. Sharp moves may still coincide with such events.
Re-entering after a stop-out can also be challenging, especially if the market continues in the same direction.
Ultimately, there’s no single best stop-loss method. Each strategy works differently depending on trading style, risk tolerance and market conditions.
Key takeaways
- A stop-loss order helps manage downside risk, not eliminate it.
- There are several approaches: risk-per-trade, risk–reward, volatility-based, support/resistance and trailing stops.
- Each method involves trade-offs between protection and flexibility.
- The effectiveness of any stop-loss strategy depends on discipline and consistency, not prediction.
Create an account Open a demo account
FAQ
What are the strategies used to implement a stop-loss?
Traders use several approaches to set stop losses, each designed to manage risk in different ways. The risk-per-trade method limits the amount of capital at risk on a single position, while the risk–reward ratio compares potential profit with potential loss. Others use volatility-based stops, which adjust for market movement, or rely on support and resistance levels drawn from technical analysis. Some prefer trailing stops, which move automatically as prices change. The most suitable method depends on individual trading style, time frame and risk tolerance.
How can I set up a stop-loss strategy?
Start by deciding how much you’re prepared to risk on each trade, often 1–2% of your account balance. Then, identify logical stop levels using recent price movements, volatility, or technical tools such as moving averages. Enter your stop when you open the trade, or use a trailing stop to follow price movements automatically. Regularly review performance and make adjustments where necessary. Consistent use of stop-loss orders helps maintain discipline and manage overall risk exposure.
What are the limitations of stop-loss orders?
Stop losses can help limit downside, but they don’t guarantee an exact exit price. During sharp market moves, orders may be filled at the next available level — a situation known as slippage. Stops set too close to the current price may trigger prematurely, while those placed too far away can result in larger-than-intended losses. Unless a guaranteed stop is used, execution will depend on prevailing market conditions. Stop losses are tools for risk control and discipline, not complete protection.
Can I trade CFDs with stop-loss orders on Capital.com?
Yes. Capital.com’s platform lets you set stop-loss and take-profit orders directly on CFD trades, helping you manage exposure automatically. You can also use trailing stops, price alerts and Trading Analytics to refine your approach. A free demo account is available to practise under real market conditions. Remember, CFDs are leveraged products and carry a high level of risk. Learn more about trading CFDs responsibly on Capital.com.