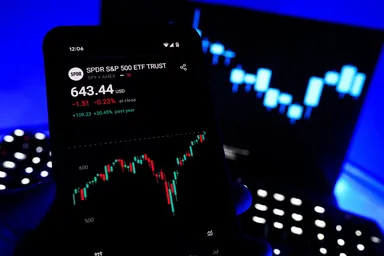
CFDs are complex instruments and come with a high risk of losing money rapidly due to leverage. 75% of retail investor accounts lose money when trading CFDs with this provider. You should consider whether you understand how CFDs work and whether you can afford to take the high risk of losing your money.
US English
544.28
0.96%
Market Trading Hours* (UTC) Opens on Monday at 13:30

Mon - Fri: 13:30 - 20:00

  • Summary
  • Historical Data
Trading сonditions
Spread 0.13
Long position overnight fee

Long position overnight funding adjustment


Margin. Your investment $1,000.00
Overnight funding adjustment -0.02629 %
Charges from full value of position ($-5.00)
Trade size with leverage ~ $20,000.00
Money from leverage ~ $19,000.00

Go to platform
-0.02629%
Short position overnight fee

Short position overnight funding adjustment


Margin. Your investment $1,000.00
Overnight funding adjustment 0.004068 %
Charges from full value of position ($0.77)
Trade size with leverage ~ $20,000.00
Money from leverage ~ $19,000.00

Go to platform
0.004068%
Overnight fee time 21:00 (UTC)
Min traded quantity 0.2
Currency USD
Margin 5.00%
Stock exchange United States of America
Commission on trade 0%

Key Stats
Prev. Close 539.08
Open 541.89
1-Year Change 19.29%
Day's Range 541.77 - 546.65
  • Last Week
  • Last Month
  • Last Year
  • Last two Years
  • Max
  • Daily
  • Weekly
  • Monthly
Date Close Change Change (%) Open High Low
Jul 25, 2024 538.30 -2.96 -0.55% 541.26 547.39 537.39
Jul 24, 2024 541.14 -7.47 -1.36% 548.61 549.10 540.30
Jul 23, 2024 553.68 -0.91 -0.16% 554.59 556.67 553.21
Jul 22, 2024 554.53 1.57 0.28% 552.96 555.21 550.96
Jul 19, 2024 548.84 -3.73 -0.68% 552.57 553.99 547.84
Jul 18, 2024 552.68 -5.83 -1.04% 558.51 559.48 550.38
Jul 17, 2024 556.91 -1.99 -0.36% 558.90 560.45 556.55
Jul 16, 2024 564.78 1.93 0.34% 562.85 565.09 562.04
Jul 15, 2024 561.44 -0.68 -0.12% 562.12 564.77 559.56
Jul 12, 2024 559.80 2.25 0.40% 557.55 563.60 557.12
Jul 11, 2024 556.41 -5.13 -0.91% 561.54 562.26 555.76
Jul 10, 2024 561.19 4.12 0.74% 557.07 561.60 556.71
Jul 9, 2024 555.79 -0.51 -0.09% 556.30 557.12 555.47
Jul 8, 2024 555.26 -0.11 -0.02% 555.37 556.20 554.13
Jul 5, 2024 554.66 2.93 0.53% 551.73 554.99 551.05
Jul 3, 2024 551.38 2.74 0.50% 548.64 551.77 548.62
Jul 2, 2024 548.90 5.17 0.95% 543.73 548.90 543.58
Jul 1, 2024 545.26 -0.28 -0.05% 545.54 545.81 542.46
Jun 28, 2024 543.99 -3.17 -0.58% 547.16 550.21 542.90
Jun 27, 2024 546.30 0.90 0.17% 545.40 546.89 544.58

Trading calculator

Calculate your hypothetical P&L if you had opened a CFD trade on a certain date (select a date) and closed on a different date (select a date).

Trade commission
0
  • 1:1
Leverage
1:1
  • 20
  • 100
  • 500
  • 1000
  • 10000
Investment
Trade size (Leverage x Investement):
Open

Close

Short Long

For the avoidance of doubt, this calculation does not include the costs of holding a position overnight (for which there will be additional charges)

SPDR S&P 500 ETF Trust Company profile

​​SPDR S&P 500 ETF Trust (SPY) is the first exchange-traded fund designed to track Standard & Poor's (S&P) 500 index. The SPDR stands for Standard & Poor's Depositary Receipts. It is one of the most popular funds in the world that tracks the S&P 500 index, which represents 500 large and mid-cap US companies and spans over 24 industry groups

Launched on 22 January 1993, SPY was the very first exchange-traded fund (ETF) listed in the US. It’s traded on the Arca exchange of the New York Stock Exchange (NYSE) under the symbol SPY. State Street Bank and Trust Co. is the trustee for the SPDR S&P 500 ETF Trust. State Street Global Advisors Funds Distributors. LLC is the marketing agent. ALPS Distributors Inc. acts as the Trust's distributor.

The Trust aims to produce returns that are broadly comparable to the price and yield performance of the S&P 500® Index, before tax and expenses.

Top Holdings

Weighted (%)

Apple Inc

6.97

Microsoft Corporation

5.88

Amazon.com Inc

3.53

Alphabet Inc. Class A

2.14

Alphabet Inc. Class C

1.99

Tesla Inc

1.74

Berkshire Hathaway Inc. Class B

1.59

NVIDIA Corporation

1.56

Meta Platforms Inc. Class A

1.31

JP Morgan Chase & Co

1.36

Index top holdings (as of 23 February 2022):


Top Holdings

Weighted (%)

Apple Inc

6.97

Microsoft Corporation

5.88

Amazon.com Inc

3.53

Alphabet Inc. Class A

2.15

Alphabet Inc. Class C

1.99

Tesla Inc

1.74

Berkshire Hathaway Inc. Class B

1.59

NVIDIA Corporation

1.56

Meta Platforms Inc. Class A

1.31

JP Morgan Chase & Co

1.36

Source: State Street Bank

As of 23 February 2022, the SPDR S&P 500 ETF Trust had a three-year average return of 20.06%. Over the last ten years,  the fund achieved an average annual return of 14.76%. The fund has generated average annual returns of 9.87% since its inception.

NEW YORK
NEW YORK
US

People also watch

Gold

2,387.21 Price
+0.940% 1D Chg, %
Long position overnight fee -0.0190%
Short position overnight fee 0.0108%
Overnight fee time 21:00 (UTC)
Spread 0.60

US100

19,029.00 Price
+1.080% 1D Chg, %
Long position overnight fee -0.0263%
Short position overnight fee 0.0041%
Overnight fee time 21:00 (UTC)
Spread 7.0

XRP/USD

0.61 Price
+1.170% 1D Chg, %
Long position overnight fee -0.0753%
Short position overnight fee 0.0069%
Overnight fee time 21:00 (UTC)
Spread 0.01168

BTC/USD

67,905.40 Price
+3.960% 1D Chg, %
Long position overnight fee -0.0616%
Short position overnight fee 0.0137%
Overnight fee time 21:00 (UTC)
Spread 106.00

Still looking for a broker you can trust?

Join the 630,000+ traders worldwide that chose to trade with Capital.com

1. Create & verify your account 2. Make your first deposit 3. You’re all set. Start trading