CFDs are complex instruments and come with a high risk of losing money rapidly due to leverage. 78.1% of retail investor accounts lose money when trading CFDs with this provider. You should consider whether you understand how CFDs work and whether you can afford to take the high risk of losing your money.
US English

Trade Rivian Automotive, Inc. - RIVN CFD

8.72
1.87%
Market Trading Hours* (UTC) Opens on Tuesday at 13:30

Mon - Fri: 13:30 - 20:00

  • Summary
  • Historical Data
  • Events
  • Income Statement
  • Balance Sheet
  • Cash Flow
Trading сonditions
Spread 0.12
Long position overnight fee

Long position overnight fee


Margin. Your investment $1,000.00
Overnight fee -0.026179 %
Charges from full value of position ($-4.97)
Trade size with leverage ~ $20,000.00
Money from leverage ~ $19,000.00

Go to platform
-0.026179%
Short position overnight fee

Short position overnight fee


Margin. Your investment $1,000.00
Overnight fee 0.003957 %
Charges from full value of position ($0.75)
Trade size with leverage ~ $20,000.00
Money from leverage ~ $19,000.00

Go to platform
0.003957%
Overnight fee time 21:00 (UTC)
Min traded quantity 1
Currency USD
Margin 5%
Stock exchange United States of America
Commission on trade 0%

*Information provided by Capital.com

Rivian Automotive Inc ESG Risk Ratings

High Medium Low Negligible

‘D’ score indicates poor relative ESG performance and insufficient degree of transparency in reporting material ESG data publicly.

More ESG coverage

Key Stats
Prev. Close* 8.56
Open* 8.27
1-Year Change* -32.27%
Day's Range* 8.27 - 8.77
52 wk Range 11.68-28.06
Average Volume (10 days) 28.15M
Average Volume (3 months) 726.31M
Market Cap 15.07B
P/E Ratio -100.00K
Shares Outstanding 957.72M
Revenue 3.78B
EPS -6.02
Dividend (Yield %) N/A
Beta -100.00K
Next Earnings Date Feb 21, 2024

All data is provided by Refinitiv, except for data marked with an asterisk, which is *data provided by Capital.com

  • Last Week
  • Last Month
  • Last Year
  • Last two Years
  • Max
  • Daily
  • Weekly
  • Monthly
Date Close Change Change (%) Open High Low
Apr 22, 2024 8.72 0.37 4.43% 8.35 8.79 8.25
Apr 19, 2024 8.56 -0.04 -0.47% 8.60 8.83 8.51
Apr 18, 2024 8.77 0.18 2.10% 8.59 9.01 8.32
Apr 17, 2024 8.67 -0.03 -0.34% 8.70 8.94 8.67
Apr 16, 2024 8.64 0.36 4.35% 8.28 8.80 8.20
Apr 15, 2024 8.33 -0.71 -7.85% 9.04 9.11 8.26
Apr 12, 2024 9.06 -0.34 -3.62% 9.40 9.45 9.02
Apr 11, 2024 9.50 -0.68 -6.68% 10.18 10.22 9.32
Apr 10, 2024 10.20 0.05 0.49% 10.15 10.35 10.05
Apr 9, 2024 10.57 0.18 1.73% 10.39 10.62 10.33
Apr 8, 2024 10.38 0.24 2.37% 10.14 10.43 10.10
Apr 5, 2024 10.03 -0.01 -0.10% 10.04 10.30 9.95
Apr 4, 2024 10.07 -0.44 -4.19% 10.51 10.64 10.07
Apr 3, 2024 10.48 0.08 0.77% 10.40 10.73 10.31
Apr 2, 2024 10.43 -0.22 -2.07% 10.65 10.74 10.20
Apr 1, 2024 11.03 0.08 0.73% 10.95 11.06 10.72
Mar 28, 2024 10.90 0.02 0.18% 10.88 11.43 10.82
Mar 27, 2024 10.92 0.39 3.70% 10.53 11.00 10.42
Mar 26, 2024 10.46 -0.36 -3.33% 10.82 10.96 10.44
Mar 25, 2024 10.59 0.00 0.00% 10.59 11.07 10.30

Rivian Automotive, Inc. Events

Time (UTC) Country Event
Tuesday, May 7, 2024

Time (UTC)

20:00

Country

US

Event

Q1 2024 Rivian Automotive Inc Earnings Release

Forecast

-

Previous

-

Time (UTC)

21:00

Country

US

Event

Q1 2024 Rivian Automotive Inc Earnings Call

Forecast

-

Previous

-
Thursday, June 20, 2024

Time (UTC)

17:00

Country

US

Event

Rivian Automotive Inc Annual Shareholders Meeting

Forecast

-

Previous

-
Tuesday, August 6, 2024

Time (UTC)

10:59

Country

US

Event

Q2 2024 Rivian Automotive Inc Earnings Release

Forecast

-

Previous

-
View all events
  • Annual
  • Quarterly
2022 2021 2020 2019
Total revenue 1658 55 0 0
Total Operating Expense 8514 4716 1021 409
Selling/General/Admin. Expenses, Total 1707 1242 255 108
Research & Development 1849 1850 766 301
Operating Income -6856 -4661 -1021 -409
Interest Income (Expense), Net Non-Operating 90 -26 2 -16
Other, Net 18 -1 1 -1
Net Income Before Taxes -6748 -4688 -1018 -426
Net Income After Taxes -6752 -4688 -1018 -426
Net Income Before Extra. Items -6752 -4688 -1018 -426
Net Income -6752 -4688 -1018 -426
Total Adjustments to Net Income 0 0 -1 0
Income Available to Common Excl. Extra. Items -6752 -4688 -1019 -426
Income Available to Common Incl. Extra. Items -6752 -4688 -1019 -426
Diluted Net Income -6752 -4688 -1019 -426
Diluted Weighted Average Shares 913 204 868.277 868.277
Diluted EPS Excluding Extraordinary Items -7.3954 -22.9804 -1.17359 -0.49063
Dividends per Share - Common Stock Primary Issue 0 0
Diluted Normalized EPS -6.98105 -20.8186 -1.17359 -0.49063
Revenue 1658 55
Cost of Revenue, Total 4199 520
Gross Profit -2541 -465
Unusual Expense (Income) 582 441
Other Operating Expenses, Total 0 663
Depreciation / Amortization 177
Jun 2023 Mar 2023 Dec 2022 Sep 2022 Jun 2022
Total revenue 1121 661 663 536 364
Total Operating Expense 2406 2094 2458 2310 2072
Selling/General/Admin. Expenses, Total 402 377 369 384 461
Research & Development 408 463 373 421 543
Operating Income -1285 -1433 -1795 -1774 -1708
Other, Net 3 -1 6 6 1
Net Income Before Taxes -1195 -1348 -1723 -1723 -1709
Net Income After Taxes -1195 -1349 -1723 -1724 -1712
Net Income Before Extra. Items -1195 -1349 -1723 -1724 -1712
Net Income -1195 -1349 -1723 -1724 -1712
Income Available to Common Excl. Extra. Items -1195 -1349 -1723 -1724 -1712
Income Available to Common Incl. Extra. Items -1195 -1349 -1723 -1724 -1712
Diluted Net Income -1195 -1349 -1723 -1724 -1712
Diluted Weighted Average Shares 942 930 925 918 908
Diluted EPS Excluding Extraordinary Items -1.26858 -1.45054 -1.8627 -1.878 -1.88546
Dividends per Share - Common Stock Primary Issue 0 0 0 0
Diluted Normalized EPS -1.27813 -1.29048 -1.98595 -1.59831 -1.80457
Revenue 1121 661 663 536 364
Cost of Revenue, Total 1542 967 1777 1058 955
Gross Profit -421 -306 -1114 -522 -591
Unusual Expense (Income) -9 229 -114 395 113
Interest Income (Expense), Net Non-Operating 87 86 66 45 -2
Other Operating Expenses, Total 0
Total Adjustments to Net Income 0
Depreciation / Amortization 63 58 53 52
  • Annual
  • Quarterly
2022 2021 2020 2019
Total Current Assets 13130 18559 3016 2293
Cash and Short Term Investments 11568 18133 2979 2264
Cash & Equivalents 11568 18133 2979 2264
Other Current Assets, Total 112 126 37 29
Total Assets 17876 22294 4602 2633
Property/Plant/Equipment, Total - Net 4088 3411 1525 313
Property/Plant/Equipment, Total - Gross 4971 3644 1563 323
Accumulated Depreciation, Total -883 -233 -38 -10
Other Long Term Assets, Total 658 324 61 27
Total Current Liabilities 2424 1313 611 185
Accounts Payable 1000 483 90 27
Accrued Expenses 1222 713 461 140
Notes Payable/Short Term Debt 0 0 0 0
Current Port. of LT Debt/Capital Leases 0 28 0
Other Current Liabilities, Total 202 117 32 18
Total Liabilities 4077 2780 742 258
Total Long Term Debt 1231 1226 47 71
Long Term Debt 1231 1226 47 71
Other Liabilities, Total 422 241 84 2
Total Equity 13799 19514 3860 2375
Redeemable Preferred Stock 0 5244 2750
Common Stock 1 1 0 0
Additional Paid-In Capital 26926 25887 302 293
Retained Earnings (Accumulated Deficit) -13126 -6374 -1686 -668
Total Liabilities & Shareholders’ Equity 17876 22294 4602 2633
Total Common Shares Outstanding 926 900 868.277 868.277
Total Receivables, Net 102 26
Accounts Receivable - Trade, Net 102 26
Total Inventory 1348 274
Total Preferred Shares Outstanding 0 0
Other Equity, Total -2
Sep 2023 Jun 2023 Mar 2023 Dec 2022 Sep 2022
Total Current Assets 12086 12861 13350 13130 14424
Cash and Short Term Investments 9133 10202 11244 11568 13272
Cash & Equivalents 7941 9260 11244 11568 13272
Other Current Assets, Total 186 156 126 112 97
Total Assets 16456 17227 18191 17876 19023
Property/Plant/Equipment, Total - Net 4155 4186 4151 4088 3959
Property/Plant/Equipment, Total - Gross 5693 5472 5218 4971 4647
Accumulated Depreciation, Total -1538 -1286 -1067 -883 -688
Other Long Term Assets, Total 215 180 690 658 640
Total Current Liabilities 2624 2274 2269 2424 2109
Accounts Payable 1134 1007 984 1000 828
Accrued Expenses 1490 1267 1285 1222 1281
Notes Payable/Short Term Debt 0 0 0 0 0
Current Port. of LT Debt/Capital Leases
Other Current Liabilities, Total 202
Total Liabilities 5904 5513 5449 4077 3686
Total Long Term Debt 2720 2718 2716 1231 1229
Long Term Debt 2720 2718 2716 1231 1229
Other Liabilities, Total 560 521 464 422 348
Total Equity 10552 11714 12742 13799 15337
Redeemable Preferred Stock
Common Stock 1 1 1 1 1
Additional Paid-In Capital 27590 27383 27217 26926 26743
Retained Earnings (Accumulated Deficit) -17037 -15670 -14475 -13126 -11403
Total Liabilities & Shareholders’ Equity 16456 17227 18191 17876 19023
Total Common Shares Outstanding 956 946 939 926 921
Total Inventory 2530 2161 1823 1348 949
Total Preferred Shares Outstanding 0 0 0 0
Total Receivables, Net 237 342 157 102 106
Accounts Receivable - Trade, Net 237 342 157 102 106
Other Equity, Total -2 0 -1 -2 -4
Short Term Investments 1192 942
  • Annual
  • Quarterly
2022 2021 2020 2019
Net income/Starting Line -6752 -4688 -1018 -426
Cash From Operating Activities -5052 -2622 -848 -353
Cash From Operating Activities 652 197 29 7
Non-Cash Items 1989 1785 41 37
Cash Interest Paid 88 2 4 5
Changes in Working Capital -941 84 100 29
Cash From Investing Activities -1369 -1794 -914 -199
Capital Expenditures -1369 -1794 -914 -197
Other Investing Cash Flow Items, Total 0 -2
Cash From Financing Activities 99 19828 2500 2811
Issuance (Retirement) of Stock, Net 102 16188 2500 2750
Issuance (Retirement) of Debt, Net -3 3640 0 61
Net Change in Cash -6324 15412 738 2259
Foreign Exchange Effects -2
Mar 2023 Dec 2022 Sep 2022 Jun 2022 Mar 2022
Net income/Starting Line -1349 -6752 -5029 -3305 -1593
Cash From Operating Activities -1521 -5052 -3606 -2238 -1034
Cash From Operating Activities 188 652 453 279 118
Non-Cash Items 414 1989 1635 923 552
Cash Interest Paid
Changes in Working Capital -774 -941 -665 -135 -111
Cash From Investing Activities -283 -1369 -1075 -777 -418
Capital Expenditures -283 -1369 -1075 -777 -418
Other Investing Cash Flow Items, Total
Cash From Financing Activities 1485 99 62 56 0
Financing Cash Flow Items
Issuance (Retirement) of Stock, Net 3 102 65 58 1
Issuance (Retirement) of Debt, Net 1482 -3 -3 -2 -1
Net Change in Cash -319 -6324 -4623 -2960 -1452
Foreign Exchange Effects -2 -4 -1

Trading calculator

Calculate your hypothetical P&L if you had opened a CFD trade on a certain date (select a date) and closed on a different date (select a date).

Trade commission
0
  • 1:1
Leverage
1:1
  • 20
  • 100
  • 500
  • 1000
  • 10000
Investment
Trade size (Leverage x Investement):
Open

Close

Short Long

For the avoidance of doubt, this calculation does not include the costs of holding a position overnight (for which there will be additional charges)

Rivian Automotive Inc. Company profile

Rivian Automotive (RIVN) is an electric vehicle (EV) manufacturer headquartered in California, US.

The company was founded in 2009 by RJ Scaringe as Mainstream Motors before being renamed Rivian. The company focuses on designing, developing and manufacturing electric vehicles as well as related software, propulsion, battery systems, supply chains, logistics and IT systems.

In 2018, Rivian announced that it will be working to create an electric pickup truck and an SUV. A number of major companies have invested in Rivian, including Ford (F), Cox Automotive and Amazon (AMZN). 

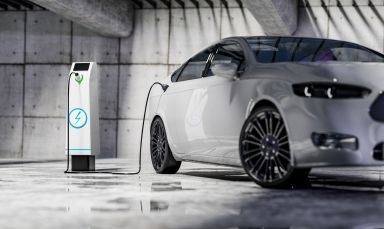
As of May 2022, the company had launched its R1T and R1S vehicles. R1T is the first ever electric pickup truck. Customer deliveries began in September 2021. R1S, the company’s electric sports utility vehicle (SUV), is expected to start customer deliveries later in 2022. 

In addition, Rivian develops commercial vans for businesses, sells wall chargers, merchandise and a number of car accessories. The company operates FleetOS, a centralised fleet management subscription platform.

In late April 2022, Rivian partnered with ClearLoop, a Silicon Ranch company that works with businesses that seek to reclaim their carbon footprints through solar energy. The company aims to achieve carbon neutrality across its entire business by 2032. 

Rivian went public on the Nasdaq stock exchange on 10 November 2021 with an initial public offering (IPO) of $78 a share under the ticker symbol RIVN.

Industry: Electric (Alternative) Vehicles

14600 Myford Road
IRVINE
CALIFORNIA 92618
US

Income Statement

  • Annual
  • Quarterly

News

Gold price in 2024: geopolitical tensions and rate-cut expectations keep XAU/USD supported

Investors are keeping a close eye on gold as the conflict in the Middle East escalates with a possibility of a full-scale regional war in the area.

07:56, 17 April 2024

US Earnings Season : JP Morgan, Citigroup, Wells Fargo

The first major US banks report quarterly earnings on Friday, April 12th, 2024. We preview what to expect from JP Morgan, Citigroup, and Wells Fargo's quarterly numbers.

16:03, 11 April 2024

Reserve Bank of New Zealand Preview: Rates expected to remain on hold as inflation fight continues

The Reserve Bank of New Zealand (RBNZ) meets on Wednesday, April 10, 2024. We preview what to expect from the meeting and its possible impact on the NZD/USD.

09:22, 11 April 2024

US CPI Preview: US inflation expected to grind lower amid fears about sticky prices

US CPI data is released on Wednesday, 10 April. We preview what to expect from the data, how it could influence US Federal Reserve policy, and analyse the NASDAQ (US Tech 100).

15:11, 9 April 2024

How escalating geopolitical tensions are impacting oil markets

The bullish momentum in oil prices remains strong as escalating geopolitical tensions raise concerns about supply.

13:34, 4 April 2024

A way forward: a roundup of recent central bank decisions

Five of the world’s most significant central banks delivered policy this week. We review the decisions and discuss their impact on the markets.

12:47, 22 March 2024

Bank of Japan Preview: will the BOJ end negative interest rates?

The Bank of Japan meets on Tuesday 19th of March. We preview what to expect from the BOJ decision and how it might impact the USD/JPY and Nikkei 225.

08:44, 18 March 2024

People also watch

BTC/USD

66,594.65 Price
0.000% 1D Chg, %
Long position overnight fee -0.0616%
Short position overnight fee 0.0137%
Overnight fee time 21:00 (UTC)
Spread 106.00

ETH/USD

3,188.28 Price
-0.250% 1D Chg, %
Long position overnight fee -0.0616%
Short position overnight fee 0.0137%
Overnight fee time 21:00 (UTC)
Spread 6.00

Gold

2,306.72 Price
-0.840% 1D Chg, %
Long position overnight fee -0.0198%
Short position overnight fee 0.0116%
Overnight fee time 21:00 (UTC)
Spread 0.40

XRP/USD

0.56 Price
-2.230% 1D Chg, %
Long position overnight fee -0.0753%
Short position overnight fee 0.0069%
Overnight fee time 21:00 (UTC)
Spread 0.01168

Still looking for a broker you can trust?

Join the 610,000+ traders worldwide that chose to trade with Capital.com

1. Create & verify your account 2. Make your first deposit 3. You’re all set. Start trading