Trade Northrop Grumman - NOC
Northrop Grumman (NOC) is an American security company offering innovative products and solutions across five key directions: Cyber, Logistics, Autonomous Systems, C4ISR, and Strike. The company was incorporated in 1939 and is located in West Falls Church, Virginia, USA. The company operates in three business sectors: Aerospace Systems, Mission Systems and Technology Services. Northrop Grumman employs approximately 67,000 staff members. It is listed on the New York (NYSE) and Pacific Stock Exchanges (PCX) and is an S&P 500 component. Track the Northrop Grumman share price at Capital.com.Latest shares articles
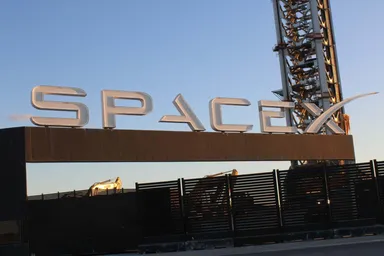
SpaceX closes up 19% on Nasdaq Stock Market debut – how to trade SpaceX SPCX CFDs
SpaceX (SPCX) opened at $150 and closed at $160.95 on its 12 June 2026 Nasdaq debut, up 19.2% from the $135 IPO price.
14:22, 15 June 2026

SpaceX IPO prices at $135 ahead of Nasdaq debut
SpaceX priced its $75bn IPO at $135 a share before its 12 June 2026 Nasdaq Global Select Market debut, with valuation, Starlink, risks and CFD trading in focus.
10:28, 12 June 2026

SpaceX IPO targets 12 June 2026 Nasdaq listing
SpaceX is targeting a 12 June 2026 IPO, with investor demand, retail allocation, governance scrutiny, Starlink growth and valuation among the main factors likely to shape market interest.
10:08, 11 June 2026

Stellantis stock forecast: Wayve-Uber robotaxi deal
Stellantis is a Milan-listed automaker, with recent developments including a non-binding robotaxi agreement with Wayve and Uber. Explore third-party STLAM price targets and technical analysis. Past performance is not a reliable indicator of future results.
14:11, 25 June 2026
Related News
Public Technologies•Europe
7 hours agoGlobeNewswire•Europe
9 hours agoReuters News•Europe
14:12 (UTC), 3 July 2026Reuters News•Europe
21:33 (UTC), 2 July 2026Reuters News•Europe
10:00 (UTC), 2 July 2026Reuters News•Europe
10:00 (UTC), 1 July 2026GlobeNewswire•Europe
13:01 (UTC), 30 June 2026