Trade British Pound / US Dollar
Browse our live chart to get all the information you need on the GBP to USD rate today.
The GBP/USD pair represents the relationship between the world’s most influential currencies: the United Kingdom’s pound and the United States’ dollar. The GBP vs USD chart shows how many US dollars – the quote currency – are needed to buy one pound – the base currency.
Backed by two large economies, both the GBP and the USD are some of the oldest and most traded currencies in the world. Their pairing – one of the forex majors – is also known as the “cable”, referring to the undersea telecoms cables that used to carry GBP/USD bid and ask quotes across the Atlantic Ocean between London and New York.
The GBP/USD pair is a very liquid market, offering forex traders attractive opportunities to take advantage of variations and adjustment in prices. Excellent liquidity combined with a high volume of continuous trade results in the low bid and ask price differences. Therefore, the popularity of this forex pair ensures that it trades at the tight spread.
Meanwhile, the GBP/USD pairing is often described as unpredictable and impulsive due to its wide price range when compared to other currency pairs, such as USD/JPY and EUR/USD. Because of its volatile nature, the pair is known for its wild movements, false alarms and many fake breakouts.
According to the Bank for International Settlements, GBP/USD is the third most popular forex pair, taking up around 14 per cent share of the daily trading volume.
Follow the pound to dollar rate live on Capital.com to spot the best trading opportunities.
Throughout its history, the GBP/USD pair has witnessed a lot of volatility, characterised by multiple price fluctuations. According to the historical GBP/USD exchange rate chart, the pair reached a record low of 1.06 in May 1985 and a record high of 2.64 in March 1972.
During the Great Recession, the value of the British pound dropped significantly. In 2007, the GBP/USD traded at around 2.10. However, once the infamous crisis hit the financial markets, the pair dropped below 1.40, losing more than a third of its value as investors flocked to the US dollar that has long-served as a safe haven currency. During the following years, the British pound had experienced a lot of turbulence before recovering to trade at an average of 1.6 against the US dollar.
In June 2016, the GBP/USD had another steep decline when the UK voted to leave the European Union. The GBP/USD pair shed 10 per cent in one trading session, losing almost 20 per cent during the following month. The uncertainty surrounding the impact of Brexit on the British economy led to investors pulling money out of the UK at a record pace.
2018 was another torrid year for the pound. The GBP began 2018 as a leading currency in terms of performance, however, the effect of Brexit negotiations and weak economy reports saw it falling to 1.25 against the dollar, the lowest level since April 2017.
The pair started 2019 at the rate of 1.27, and has fluctuated between 1.20 and 1.34 throughout the rest of the year. In March 2020, against the background of unprecedented market turbulence amid the Covid-19 pandemic and the post-Brexit trade deal uncertainty, the GBP/USD rate fell to its multi-year low of 1.144.
With Capital.com’s comprehensive chart, you can not only quickly view the rate of the pound to dollar today, but also trace the FX rate GBP to USD in historic terms.
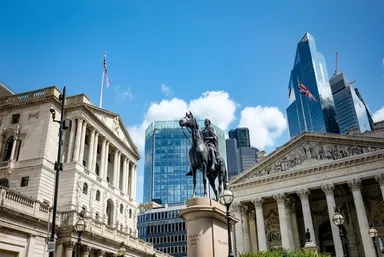
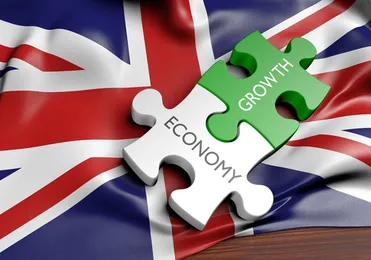
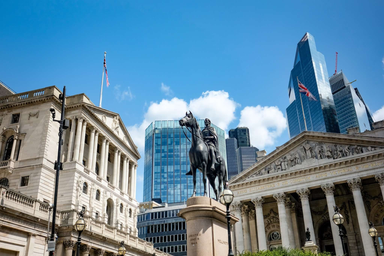
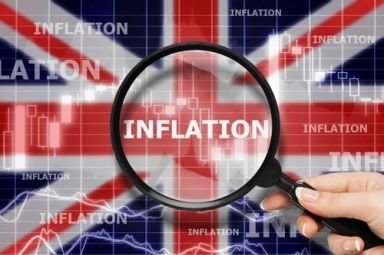
When trading the GBP/USD forex pair, it is recommended to pay attention to economic releases and changes in monetary policy made by the institutions in control – the Bank of England and the US Federal Reserve. In addition, it is important to consider major economic changes in the UK and the US, including GDP figures, import/export data, inflation rates, employment statistics and inflation rates.
Explore the pound to dollar live chart at Capital.com to keep track of the changes in the rate of the pound to dollar in real-time.
Whether you're checking a quick what-if scenario or planning a longer-term position, try our forex profit & loss calculator to model how a position might have performed based on live pricing and your chosen setup.
Latest currencies articles