Trading gold ahead of US CPI
Traders await updates on bullion tariffs after “misinformation” claim, but that isn’t the only event this week on the fundamental front that can move the needle.
It might have been a positive week for gold prices up 1% and briefly breaching $3,400, but those gains have largely been undone as of writing this morning. The catalyst for those gains was the FT (Financial Times) report regarding US tariffs on imports of one-kilo and 100-ounce gold bars, but a White House official said they intend to “issue an executive order in the near future clarifying the misinformation” regarding the report. That’s just one item to look out for this week in terms of what can influence the precious metal’s price.
There’s (1) the US-China tariff deadline tomorrow where an extension seems likely but is no guarantee just yet, (2) US CPI (Consumer Price Index) releasing the same day where the figures are for the month of July and are expected to show y/y (year-on-year) growth for both headline and core (which excludes food and energy) with m/m (month-on-month) increases for the latter above the central bank’s comfort zone, (3) more FOMC (Federal Open Market Committee) members speaking this week after what have been mixed comments tilting to the dovish side, (4) producer prices on Thursday to see how tariffs are feeding into that aspect of the economy, (5) retail sales and preliminary consumer inflation expectations on Friday on a day where (6) the attention will likely shift to the Trump-Putin meeting in Alaska for its impact on oil, gold and more.
In terms of recent FOMC members speaking, there was Bowman (who voted for a rate cut) seeing three rate cuts this year as any further delay would “result in a deterioration in labor market conditions and a further slowing in economic growth”, with the latest data releases “consistent with greater risks to the employment side of our dual mandate”. But not all are talking about loosening, with Musalem that they are “are not missing on our employment mandate” rather “missing on our inflation target” and in turn favoring ongoing caution. Market pricing (CME’s FedWatch) is still very much in favor of a September rate cut even if not fully priced in, via slight majority anticipating a second rate reduction in October, and near a coin toss on a third in December.
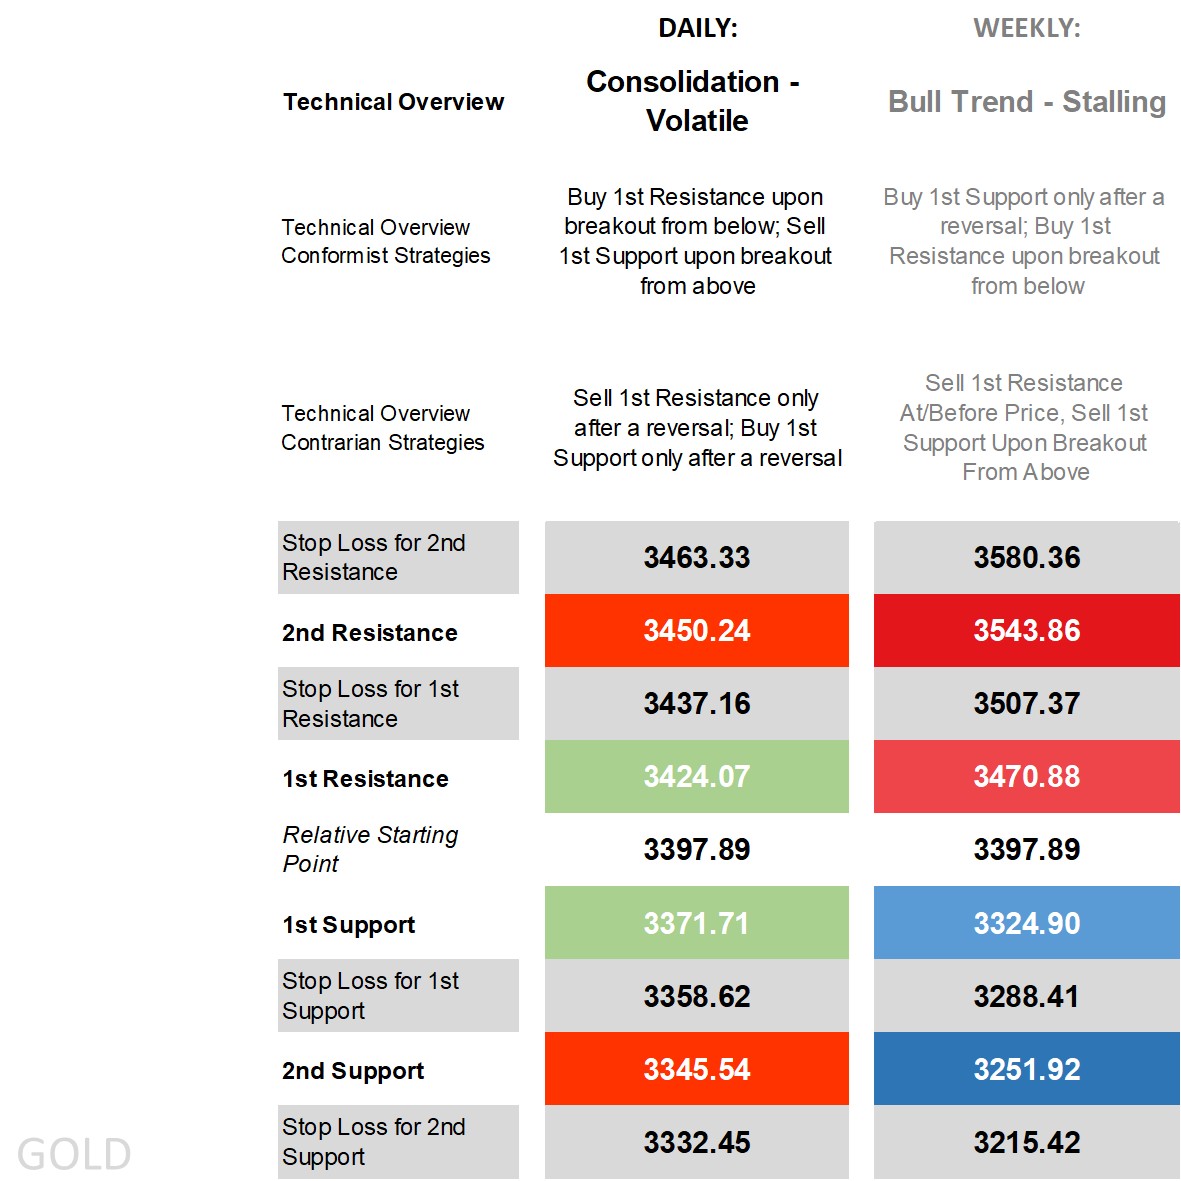
Gold’s technical overview, strategies and levels
It’s been mostly rangebound movement over the past four months for prices of gold, but where movement from the top to the bottom at times larger than $200. Price is currently above most of its main daily moving averages and moving back towards the middle of the daily Bollinger Band, on the DMI (Directional Movement Index) front a negative cross not far off occurring, an ADX (Average Directional Movement Index) not in trending territory even if at times has gotten near that classification, and an RSI (Relative Strength Index) nearing the middle. Mostly neutral technical indicators then, adding up to a classification that’s usually ‘consolidation’ had it not been for the larger bands that we’re working with, keeping it more ‘consolidation – volatile’.
That puts breakout strategies in the conformist camp of which have already been rewarded this morning with a move beneath the 1st Resistance (thus far) giving breakouts the edge, with contrarian reversals initially stopped out unless done so with greater caution waiting for price to significantly break beneath the 1st Support before activating a buy strategy.
Zooming out to the weekly time frame which incorporates more historic bullish bias, and the overview is a stalling bull trend, but even then, means buying off the weekly 1st Support only after a reversal should price recover to that level, else letting it slide and handing the trophy to contrarian sell-breakouts.
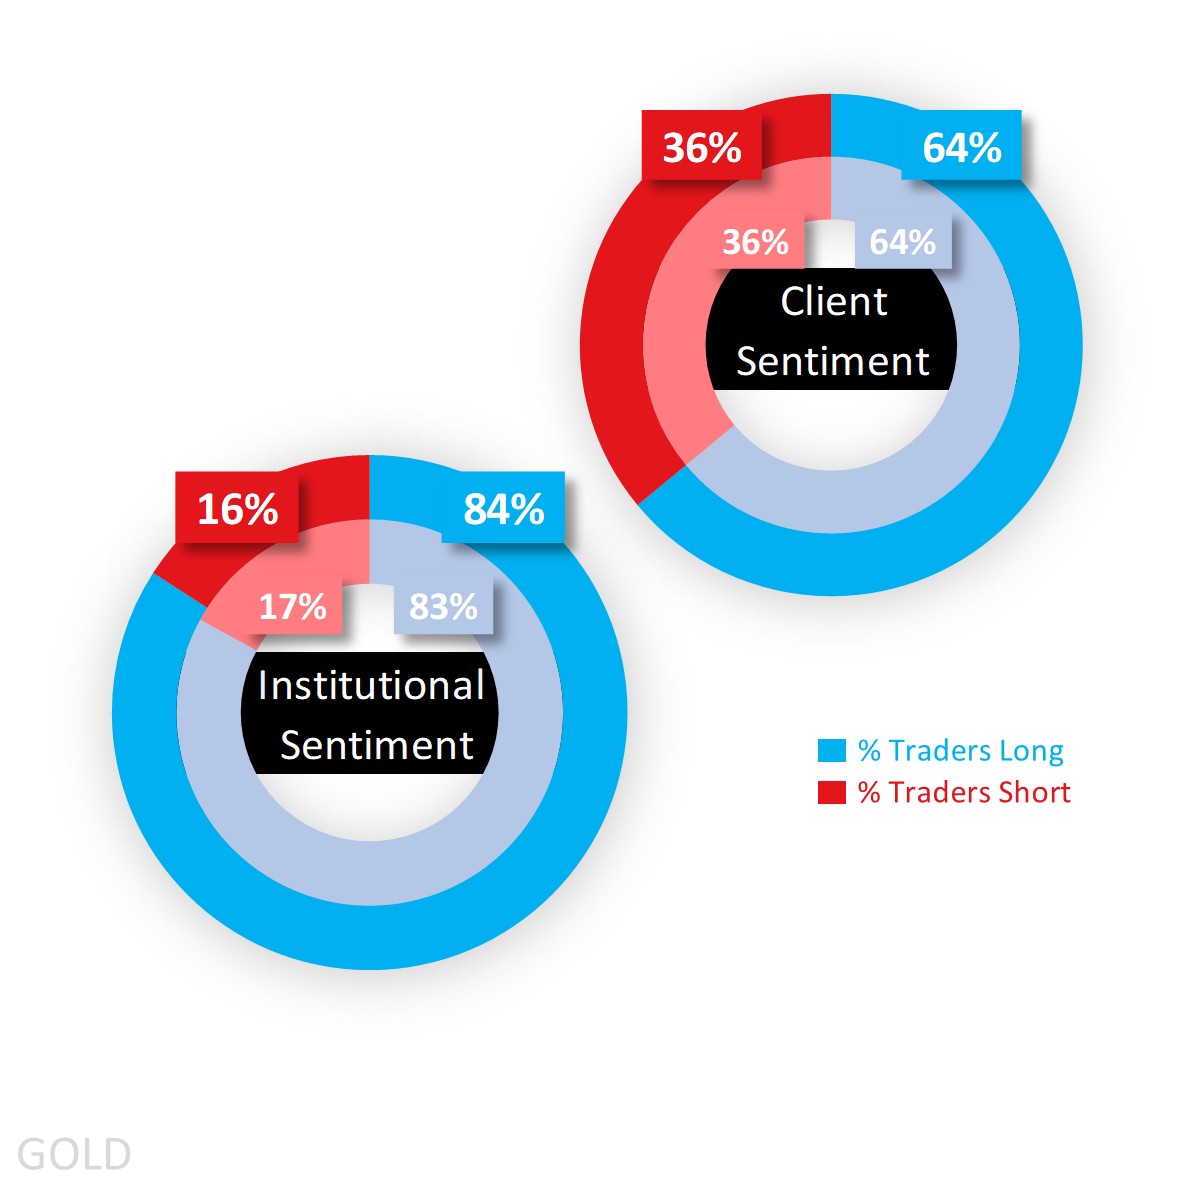
Capital.com’s client sentiment for Gold
It’s been relatively quiet on the sentiment front, with Capital.com clients majority buy and holding at 64% just shy of heavy buy territory before the pullback this morning took it to a heavy 70%. Institutional traders have a much stronger long bias reaching extreme buy territory and at 84% according to the latest CoT (Commitment of Traders) report out of the CFTC, and due to an increase in long positions (by 10,953) and a simultaneous drop in shorts (by 2,501 lots).
Client sentiment mapped on the daily chart
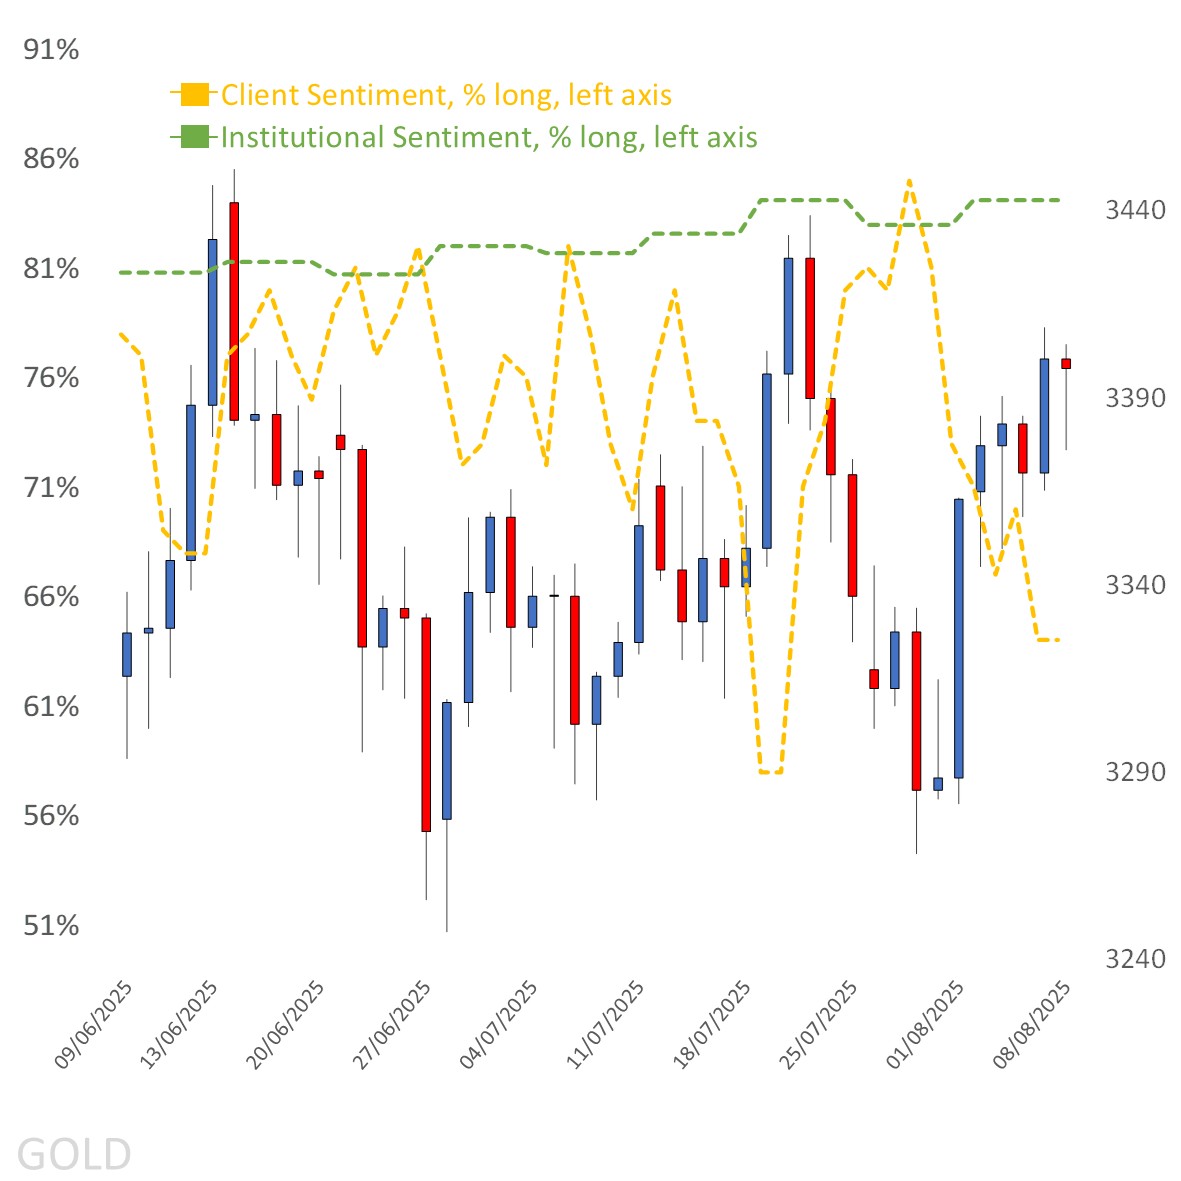
Source: Capital.com
Period: JUNE 2025 – AUGUST 2025
Past performance is not an indicator of future results.
Gold’s chart on Capital.com platform with key technical indicators
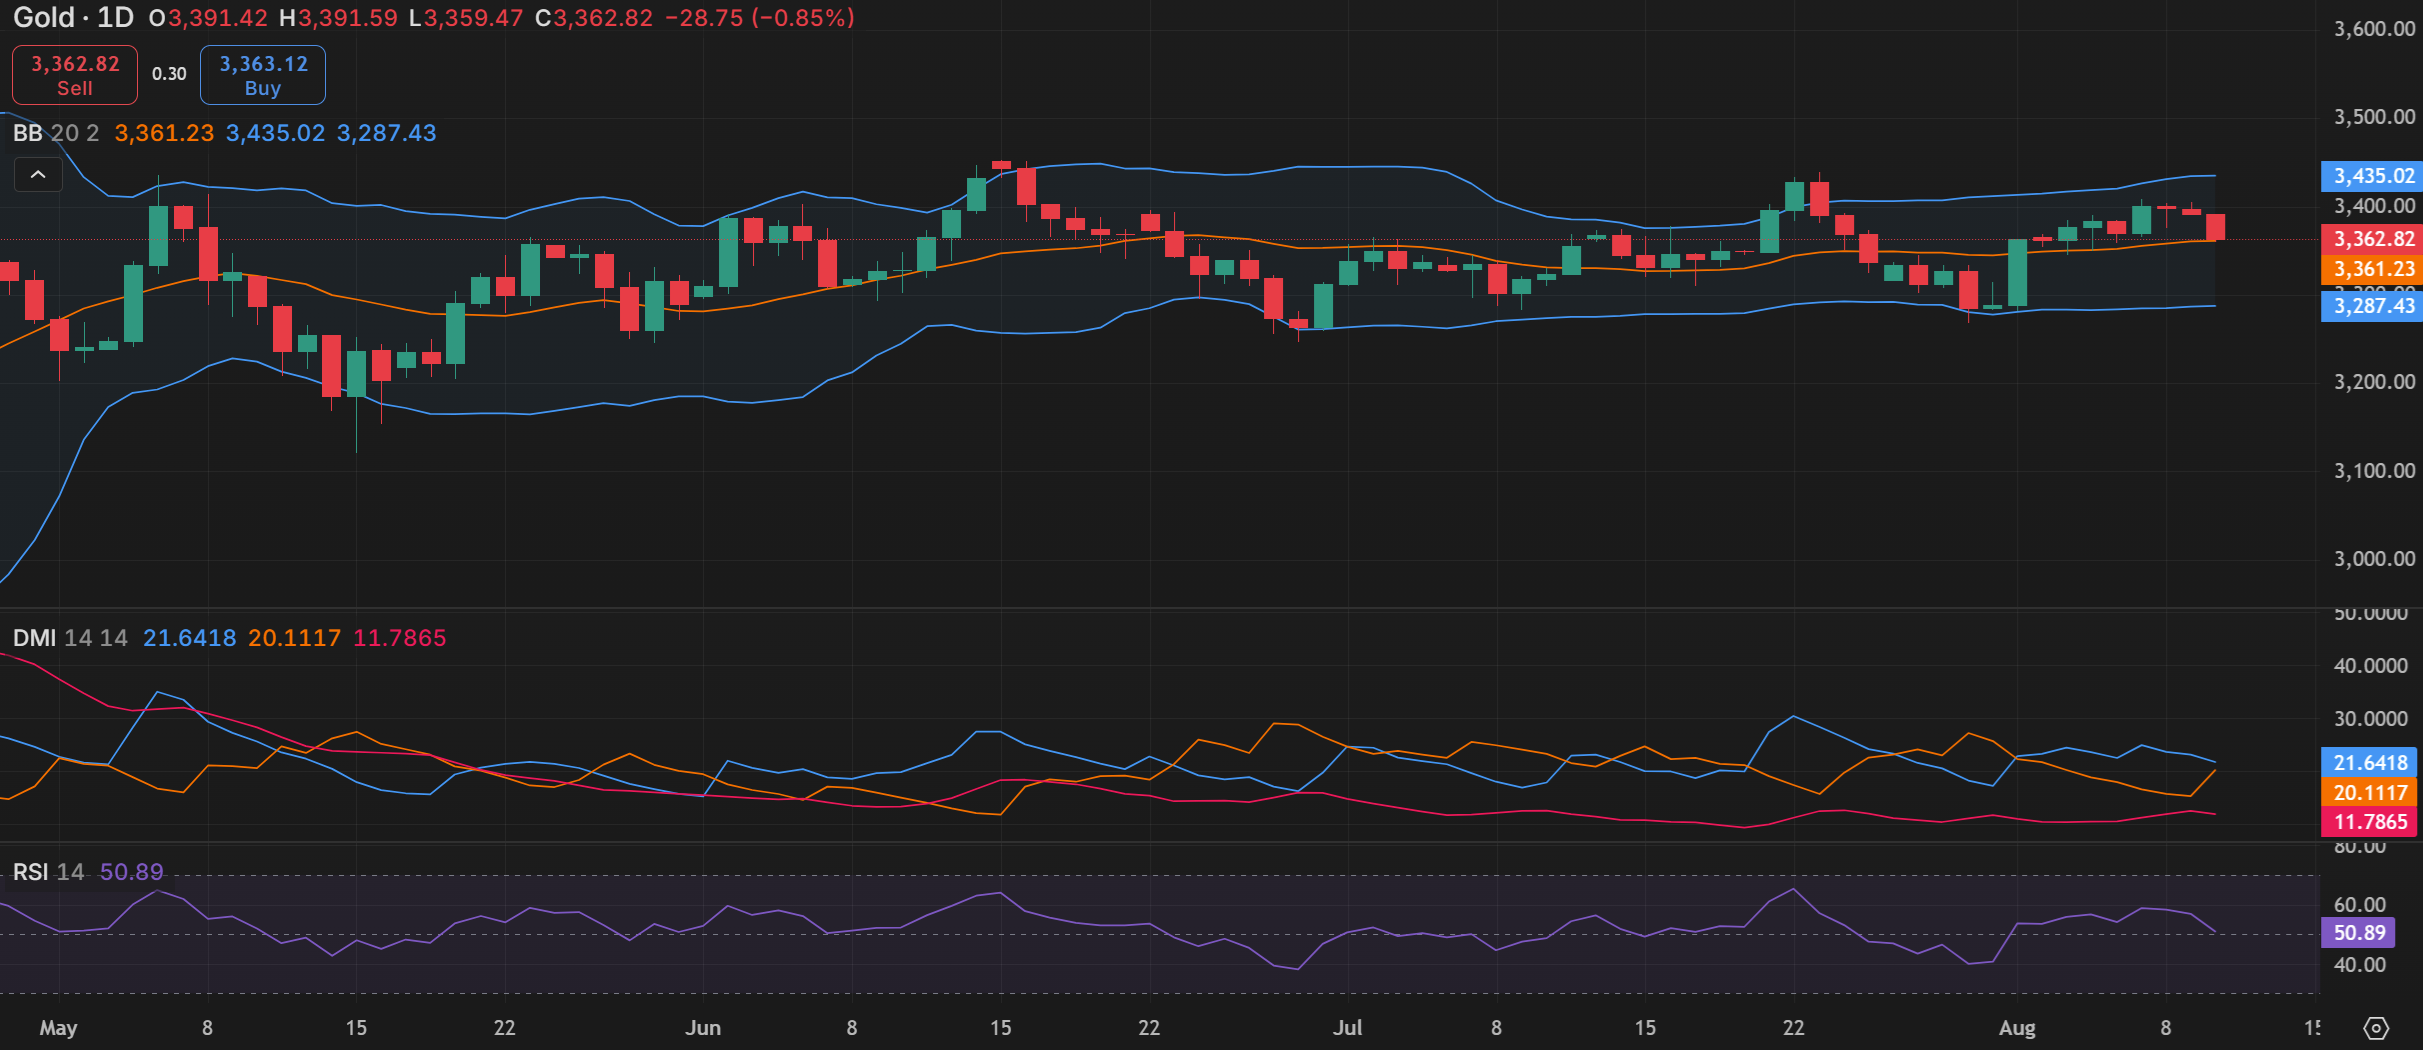
Source: Capital.com
Period: MAY 2025 – AUGUST 2025
Past performance is not an indicator of future results.