Valneva stock forecast: Third-party price targets
Valneva is a publicly listed biotechnology company focused on vaccine research, development and commercialisation, with its shares traded in Europe and the US and influenced by regulatory and clinical developments. Explore third-party VLA price targets and technical analysis.
Valneva SE (VLA) is trading around €4.11 in early European dealing on 5 February 2026, within an intraday range of €3.91–€4.28 as of 9:58am UTC. Past performance is not a reliable indicator of future results.
The stock is moving amid mixed news flow on IXCHIQ, with Valneva announcing on 19 January 2026 that it would voluntarily withdraw its US biologics licence application and IND for the chikungunya vaccine following an FDA suspension and the emergence of a new serious adverse event under review (Valneva, 19 January 2026). Sentiment is also shaped by a 3 February 2026 announcement that Valneva and Brazil’s Instituto Butantan have begun a pilot vaccination strategy in selected Brazilian municipalities using single-shot IXCHIQ, with donated doses intended to generate real-world effectiveness and safety data in an endemic setting (Valneva, 3 February 2026).
Valneva stock forecast 2026–2030: Third-party price targets
As of 5 February 2026, third-party Valneva stock predictions indicate a broad spread of 12-month price targets in both euros and US dollars, reflecting differing views on earnings visibility, regulatory developments and vaccine demand. These third-party forecasts rely on external models and assumptions and do not represent Capital.com’s own views or guidance.
Taken together, these estimates illustrate the degree of uncertainty surrounding Valneva’s outlook rather than a single expected price outcome.
MarketScreener (consensus snapshot)
MarketScreener reports that the average 12-month VLA stock forecast stands at about €6.66, derived from six analyst estimates, compared with a last close near €4.11 at that time. The service notes that this implies potential upside, with a prevailing 'buy' consensus as analysts factor in expected revenue trends, updated earnings guidance and progress across the vaccine pipeline (MarketScreener, 7 January 2026).
Intellectia (Wall Street average)
Intellectia states that Wall Street analysts assign Valneva an average one-year target of $10.28 for the Nasdaq-listed shares, with estimates ranging from $7.55 to $13. The platform adds that such targets can lag market moves, as they are revised alongside changes in analyst ratings and underlying assessments of the company’s prospects (Intellectia AI, 20 January 2026).
Public.com (forecast summary)
Public.com reports that two analysts covering Valneva maintain a 'Strong Buy' consensus rating, with a 2026 price projection of $15.50 for the Nasdaq-listed shares. The service notes that these figures reflect external analyst expectations, while highlighting that forecasts remain sensitive to changes in fundamentals, sentiment and wider sector volatility (Public.com, 3 February 2026).
Predictions and third-party forecasts are inherently uncertain, as they cannot fully account for unexpected market developments. Past performance is not a reliable indicator of future results.
VLA stock price: Technical overview
The VLA stock price is trading around €4.11 as of 9:58am UTC on 5 February 2026, holding just above the classic pivot near €4.01, with immediate resistance at R1 around €4.37. The daily simple moving averages (SMAs) cluster nearby, with the 20-, 50-, 100- and 200-day SMAs grouped around €4.15, €3.95, €4.08 and €3.61 respectively. This configuration suggests price action remains anchored within a broad moving-average band rather than aligned to a single dominant level.
Momentum indicators remain neutral. The 14-day RSI near 51 sits in mid-range territory, while an ADX reading around 21 points to a modestly developed trend rather than a strong directional move. A daily close above €4.37 would bring the €4.86 R2 area back into focus, while a move below the €4.01 pivot could expose the €3.61 longer-term SMA region, with S1 near €3.52 acting as the next support zone if the moving-average band fails (TradingView, 5 February 2026).
This technical analysis is provided for information only and does not constitute financial advice or a recommendation to trade.
Valneva share price history (2024–2026)
VLA’s stock price has risen over the past two years, moving from about €2.33 at the start of 2025 to around €4.12 by 5 February 2026. The stock spent much of early 2024 trading in a €2.50–€3 range before trending higher through mid-2024 and into 2025. This advance included a notable move from roughly €2.33 on 2 January 2025 to above €5 by early October of that year.
More recently, after peaking near €5.20 in early October 2025, the price retreated towards the mid-€3s to low-€4s. Valneva closed at €3.73 on 31 December 2025 before edging higher to around €4.12 by 5 February 2026, highlighting both the recovery and the volatility seen over the period.
Past performance is not a reliable indicator of future results. Share prices are indicative and may differ from live market prices.
Valneva (VLA): Capital.com analyst view
Valneva’s share price has recovered from the low-€2 area at the start of 2025 to around €4.11–€4.12 by early February 2026, with recent trading largely oscillating between approximately €3.50 and just above €5. This performance has unfolded alongside gradual revenue growth and reiterated 2025 guidance linked to higher product sales and tighter cash management. At the same time, the shares have experienced pronounced swings around news flow and quarterly updates.
Market attention continues to focus on Valneva’s vaccine portfolio, including the chikungunya candidate IXCHIQ. Corporate updates and regulatory decisions have, at different points, supported the longer-term narrative or raised questions around earnings visibility. While positive read-across from product-sales growth or real-world data could support interest in the shares, safety reviews, trial outcomes, regulatory delays and broader biotech sentiment may also weigh on the price, particularly given the company’s history of losses and reliance on a relatively concentrated pipeline.
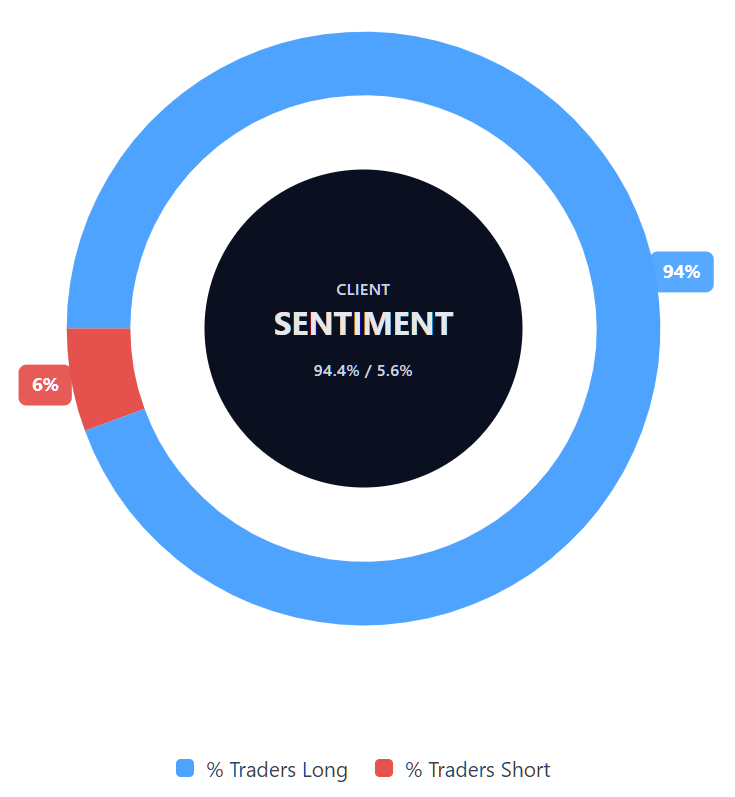
Capital.com’s client sentiment for Valneva CFDs
As of 5 February 2026, Capital.com client positioning in Valneva CFDs is currently skewed towards the long side, with buyers accounting for around 94.4% of open positions versus 5.6% for sellers. This represents a heavily one-sided long bias, leaving buyers ahead by approximately 88.9 percentage points. The data reflects open positions held by Capital.com clients at a specific point in time and may change as positions are opened or closed.
Summary – Valneva 2026
- Valneva’s share price traded within a wide €2.0–€5.2 range over the past two years, rising from the low-€2s in early 2025 to around €4.11–€4.12 by 5 February 2026.
- The stock recorded a sharp upswing through mid-to-late 2025, briefly moving above €5.00 in October before easing back into the mid-€3s to low-€4s by year-end.
- Daily technical indicators show price holding near the €4.01 pivot, with key simple moving averages clustered around €4.15, €3.95, €4.08 and €3.61, while the 14-day RSI remains in neutral territory.
- Recent news around the chikungunya vaccine IXCHIQ and broader pipeline developments has been a key driver of volatility, with a mix of supportive and cautious updates continuing to influence market sentiment.
Past performance is not a reliable indicator of future results.
FAQ
Who owns the most Valneva stock?
Valneva’s share register includes a mix of institutional investors, investment funds and retail shareholders, reflecting its dual listing in Europe and the US. Public disclosures do not typically identify any single shareholder with a controlling stake, meaning ownership appears relatively dispersed. Institutional positions can change over time, as funds adjust exposure in response to earnings expectations, regulatory developments and broader sentiment towards the biotechnology sector.
What is the five-year Valneva share price forecast?
There is no single agreed five-year VLA stock forecast. Longer-term projections published by third-party platforms vary widely and depend on assumptions around vaccine uptake, regulatory outcomes, funding conditions and sector trends. Some models extend several years ahead, but these projections involve a high degree of uncertainty and are best viewed as illustrative scenarios rather than firm expectations of future price performance.
Is Valneva a good stock to buy?
Whether Valneva is considered attractive will vary according to individual objectives, risk tolerance and time horizon. The company provides exposure to vaccine development and commercialisation, which may present opportunities but also carries regulatory, clinical and execution risks. Analysts’ views remain mixed, with published price targets reflecting both potential upside scenarios and identifiable challenges. As with many biotech stocks, outcomes can differ materially from expectations.
Could Valneva stock go up or down?
Valneva’s share price can move in either direction and has experienced periods of pronounced volatility. Price movements may be influenced by clinical trial results, regulatory decisions, earnings updates, funding announcements and broader sentiment across the biotech sector. Wider factors, including shifts in risk appetite or changes in healthcare policy, may also affect performance. As a result, short- and medium-term price behaviour can be difficult to anticipate and may not follow a consistent or linear pattern.
Should I invest in Valneva stock?
Deciding whether to invest in Valneva involves assessing personal financial circumstances, investment objectives and tolerance for risk. Biotechnology stocks can experience sharp price fluctuations and are often sensitive to company-specific and sector-wide news. The information and forecasts referenced in this article are provided for educational purposes only and do not constitute investment advice. Investors may wish to conduct independent research or seek professional guidance before making any investment decisions.
Can I trade Valneva CFDs on Capital.com?
Yes, you can trade Valneva CFDs on Capital.com. Trading share CFDs lets you speculate on price movements without owning the underlying asset and to take long or short positions. However, contracts for difference (CFDs) are traded on margin, and leverage amplifies both profits and losses. You should ensure you understand how CFD trading works, assess your risk tolerance, and recognise that losses can occur quickly.