Dow Jones, S&P 500 & Nasdaq 100 forecasts: Payrolls, oil and Fed
US Tech 100, US 500 and US Wall Street 30 track major US equity markets, with recent moves shaped by May payrolls, oil prices and chip-sector earnings. Explore third-party US Tech 100, US 500, US Wall Street 30 price targets. Past performance is not a reliable indicator of future results.
The Nasdaq 100 index – referred to as the US Tech 100 (US100) on CFD trading platforms such as Capital.com – trades at 29,585.70 as of 3:47pm UTC on 8 June 2026, within an intraday range of 28,802.30–30,341.80. The index is recovering some ground after last week’s sharp losses, during which the Nasdaq Composite fell approximately 4.7% over five sessions, its steepest weekly decline since early 2025. The S&P 500 index – referred to as the US 500 (US500) – stands at 7,453, within a session range of 7,356.10–7,573.80, while the Dow Jones Industrial Average index – referred to as the US Wall Street 30 (US30) – is at 51,044.30, moving between 50,634.80 and 51,687. Past performance is not a reliable indicator of future results.
The partial rebound across all three indices follows several drivers. A stronger-than-expected May non-farm payrolls report – showing 172,000 jobs added against estimates near 80,000 – reinforced expectations that the Federal Reserve could keep monetary policy restrictive for longer, pushing the 10-year US Treasury yield to around 4.55% by Friday's close (T. Rowe Price, 5 June 2026). Renewed Iran–Israel tensions have lifted Brent crude futures to near $97 per barrel, adding an inflationary overhang, while chip-sector weakness – following disappointing quarterly guidance from CrowdStrike and Broadcom – weighed particularly heavily on the US100 (Wall Street Journal, 8 June 2026). Meanwhile, Citigroup raised its year-end S&P 500 target to 8,100, citing AI earnings tailwinds, which offered some support to sentiment in Monday's session (24/7 Wall St., 8 June 2026).
US Tech 100, US 500, US Wall Street 30 price forecast 2026-2030: Analyst price target view
As of 8 June 2026, third-party US Tech 100, US 500, US Wall Street 30 predictions coincide with a backdrop of AI-driven earnings momentum, elevated oil prices linked to the Iran conflict, and a Federal Reserve on hold. The following targets summarise leading forecasts for the US Tech 100 (US100), US 500 (US500), and US Wall Street 30 (US30) markets.
Reuters (consensus poll, US500 and US30)
A Reuters poll of 47 market strategists and portfolio managers, surveyed between 15 and 26 May 2026, placed the median year-end 2026 forecast for the S&P 500 at 7,620 – a 1.3% gain from the 26 May closing level of 7,519.12. The Dow Jones Industrial Average consensus stood at 52,500 for end-2026. The survey also noted expectations that the S&P 500 could reach 8,050 by mid-2027, with the range of individual forecasts showing diverging views on how the Iran conflict and Federal Reserve policy could shape the second half of the year (Reuters, 27 May 2026).
UBS (house view, US500)
UBS Global Wealth Management raised its year-end 2026 S&P 500 forecast to 7,900 from a previous target of 7,500, citing resilient consumer spending and ongoing AI investment as the main drivers of the revision. The firm also set a June 2026 marker at 8,200 and lifted its 2026 earnings-per-share estimate to $335 from $310, maintaining an 'attractive' rating on US equities as of its 22 May 2026 update (Reuters, 22 May 2026).
Goldman Sachs (house view, US500)
Goldman Sachs raised its year-end 2026 S&P 500 target to 8,000 from 7,600, attributing the upgrade to continued strength in corporate earnings. The new target represented a 6.4% rise from the index's 26 May closing level of 7,519.12. The revision reflected the firm's view that earnings growth had outpaced earlier forecasts, with expectations for year-over-year S&P 500 earnings growth near 25% by late May 2026, according to LSEG data cited in the same Reuters report (Reuters, 27 May 2026).
Daily Forex (technical outlook, US100)
Senior analyst Christopher Lewis noted that the US Tech 100 broke and held above the 30,000 level during May 2026, describing the sustained close above that mark as a notable technical signal. He said continued buying on dips remained the condition for further upside in June. Lewis cited the artificial intelligence trade as the dominant structural driver, while flagging unresolved Iran–US negotiations and potential headline shocks as key risks that could generate volatility within the broader upward trend (Daily Forex, 29 May 2026).
T. Rowe Price (weekly market update, US100 and US500)
T. Rowe Price's weekly update for the period ending 5 June 2026 noted that major US indices finished the week lower, led by the Nasdaq Composite, which fell 4.68% – its steepest weekly loss since early 2025. The firm said a stronger-than-expected May jobs report reinforced expectations that the Federal Reserve would keep rates elevated for longer. It also noted that May non-farm payrolls significantly exceeded forecasts, boosting expectations of tighter-for-longer Fed policy and prompting simultaneous declines in both equities and bonds, with the technology sector bearing the largest proportion of the losses (T. Rowe Price, 5 June 2026).
Predictions and third-party forecasts are inherently uncertain, as they cannot fully account for unexpected market developments. Past performance is not a reliable indicator of future results.
US Tech 100, US 500, US Wall Street 30 prices: technical overview
US Tech 100
US100’s price trades at 29,585.70 as of 3:47pm UTC on 8 June 2026, within a session range of 28,802.30–30,341.80. Price sits below its 10- and 20-day SMAs at roughly 30,113 and 29,677 respectively, though it remains above the 50/100/200-day SMA cluster at approximately 27,564 / 26,267 / 25,583. This leaves the longer-term structure broadly supportive, even as near-term momentum has softened. The 20-over-50 SMA alignment remains intact, while the 14-day RSI reads 54.23, a neutral mid-range reading. ADX at 34.89 suggests an established trend remains in force.
The first topside area to watch is classic R1 at 31,368. A daily close above that level would put R2 at 32,403 back in view and could reopen the path toward the 32,400 area. On pullbacks, the classic pivot at 29,435 provides initial support. Below that, the 100-day SMA near 26,267 acts as the next meaningful moving-average shelf. A move below that level would risk a decline toward S1 at 28,400, the nearest clearly defined downside reference (TradingView, 8 June 2026).
US 500
US500’s price trades at 7,453 as of 3:47pm UTC on 8 June 2026, within a session range of 7,356.10–7,573.80. Price is broadly in line with its 20-day EMA at 7,452.62 and below the 10-day SMA at 7,536.51. The 50/100/200-day SMA cluster sits lower at approximately 7,175 / 7,000 / 6,864, with all three measures in buy alignment. The 14-day RSI stands at 53.64, a neutral mid-range reading, while ADX at 27.38 suggests the established trend structure remains in place.The nearest topside reference is classic R1 at 7,728. A daily close above that level would put R2 at 7,876 in view, with the round 7,900 figure as the next broader marker. Initial support rests at the classic pivot near 7,451, close to current price. A slip below that level would expose the 100-day SMA at approximately 7,000, the primary moving-average shelf. A sustained break of that area would risk a move toward S1 at 7,303 (TradingView, 8 June 2026).
US Wall Street 30
US30’s price trades at 51,044.30 as of 3:47pm UTC on 8 June 2026, within a session range of 50,634.80–51,687. The index remains above its full SMA stack, with the 10/20/50/100/200-day SMAs aligned at roughly 50,935 / 50,404 / 49,174 / 48,830 / 47,923. All remain in buy alignment, pointing to a broadly constructive trend. The Hull Moving Average (9) at 51,131 has a sell reading, which suggests some short-term momentum exhaustion near current levels. The 14-day RSI at 58.97 sits in the upper-neutral range, while ADX at 27.26 confirms an established trend.The first resistance area to watch is classic R1 at 51,786. A daily close above that level would put R2 at 52,536 in view, with the round 52,500 figure as the broader upside reference. On pullbacks, initial support sits at the classic pivot at 50,350, which broadly coincides with the 20-day SMA near 50,404 and forms a near-term shelf. A move below that area would risk a decline toward S1 at 49,600, followed by the 100-day SMA at approximately 48,830 (TradingView, 8 June 2026).
This is technical analysis for informational purposes only and does not constitute financial advice or a recommendation to buy or sell any instrument.
US Tech 100, US 500, US Wall Street 30 price history (2024–2026)
The US Tech 100, US 500 and US Wall Street 30 have each navigated a volatile two-year stretch, shaped by post-pandemic rate anxiety, AI-driven sentiment and a sharp tariff shock in early 2026 before recovering to their current levels.
US Tech 100
The US100 price closed 2024 at 21,015.30, having rallied consistently throughout the year on AI optimism and resilient big-tech earnings. It ended 2025 at 25,222.80, a gain of roughly 20% over the calendar year, as enthusiasm around artificial intelligence investment continued to lift the index’s heavyweight technology constituents.
The index hit turbulence in early April 2026 when sweeping US tariff announcements triggered a broad risk-off selloff, dragging the US Tech 100 as low as 23,776.90 on 7 April before buyers returned. A partial recovery followed, but last week’s stronger-than-expected May jobs report – which pushed back Federal Reserve rate-cut expectations – sent the index sharply lower again, with the close on 5 June 2026 falling to 28,783.80.
US Tech 100 closed at 29,585.70 on 8 June 2026, which is approximately 17.4% up year to date and 36.1% up year on year.
Past performance is not a reliable indicator of future results. Prices are indicative and may differ from live market prices.
US 500
The US500 price closed 2024 at 5,882.70 and ended 2025 at 6,848.10, a calendar-year advance of around 16.4%, supported by broadening earnings growth and easing inflation across the period. The index pushed to fresh highs in the opening weeks of 2026, briefly trading above 7,000 in late January, before macro uncertainty began to weigh on sentiment.
April 2026 brought the index’s steepest drawdown of the two-year period, with the US 500 sliding to a session low of 4,808.40 on 7 April amid the tariff selloff before rebounding sharply. The recovery carried the index back above 7,500 by late May 2026, though Friday’s jobs-driven selloff on 5 June pulled the close back to 7,355.90.
US 500 closed at 7,453 on 8 June 2026, which is approximately 8.7% up year to date and 24.3% up year on year.
Past performance is not a reliable indicator of future results. Prices are indicative and may differ from live market prices.
US Wall Street 30
The US30 price closed 2024 at 42,509 and finished 2025 at 48,066.50, an advance of roughly 13.1% over the year as financials, industrials and healthcare constituents added to gains already built in the prior period. The index crossed 50,000 for the first time in early February 2026, reflecting the broadening market rally before trade-war fears interrupted momentum.
The April 2026 tariff shock hit the US Wall Street 30 hard, with the index falling to an intraday low of 36,500.80 on 6 April – its weakest level since mid-2024 – before recovering nearly 40% of that loss within two weeks. The index reclaimed the 50,000 level by late May and has broadly held it through early June despite tech-led volatility.
US Wall Street 30 closed at 51,024.70 on 8 June 2026, which is approximately 5.6% up year to date and 19.4% up year on year.
Past performance is not a reliable indicator of future results. Prices are indicative and may differ from live market prices.
US100 vs US500 vs US30: Capital.com analyst outlook
US equity indices have had a turbulent but ultimately resilient 2026. The US Tech 100 rose toward 30,760 in early June before a sharp payrolls-driven reversal pulled it lower, illustrating how quickly AI-fuelled optimism can give way to rate-sensitivity concerns. The US 500 and US Wall Street 30 have followed a broadly similar pattern, with both indices recovering strongly from their April 2026 lows – driven in part by improving earnings expectations and a cautiously supportive macro backdrop – yet remaining exposed to the same headwinds: sticky inflation, elevated oil prices tied to ongoing Iran-related tensions, and a Federal Reserve that has shown little inclination to ease policy in the near term.
The picture is genuinely mixed. A stronger-than-expected labour market could support corporate revenues and consumer spending, which may help underpin earnings growth – but it also reduces the likelihood of rate cuts that have historically provided a tailwind for growth-oriented indices. Similarly, AI investment continues to attract capital into the technology sector, yet stretched valuations and concentration risk in a handful of mega-cap names mean any disappointment in earnings guidance could translate into outsized index moves in either direction.
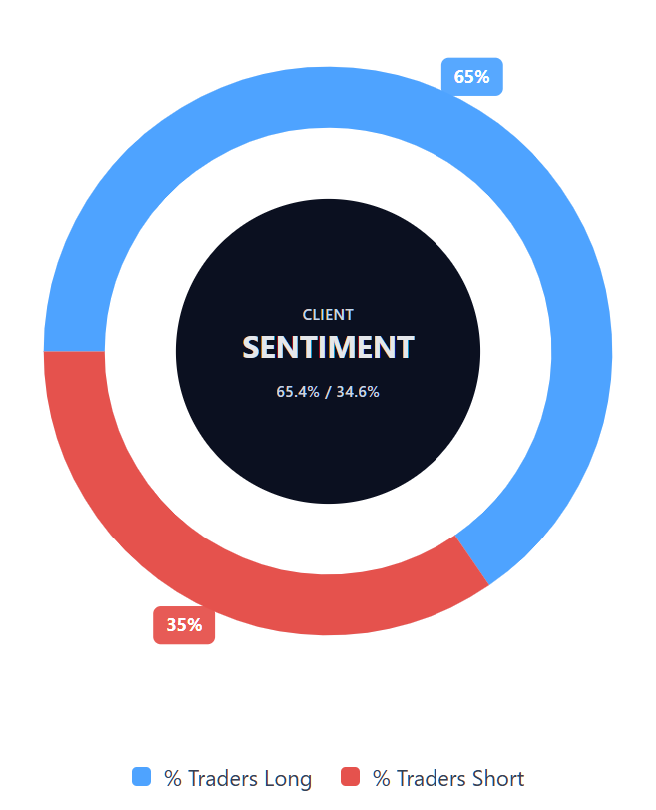
Capital.com’s client sentiment for US100 CFDs
As of 8 June 2026, Capital.com client positioning in US100 CFDs shows 65.4% long vs 34.6% short, keeping it in majority-buy territory but below extreme levels. Buyers lead by 30.8 percentage points. This snapshot reflects open positions on Capital.com and can change.
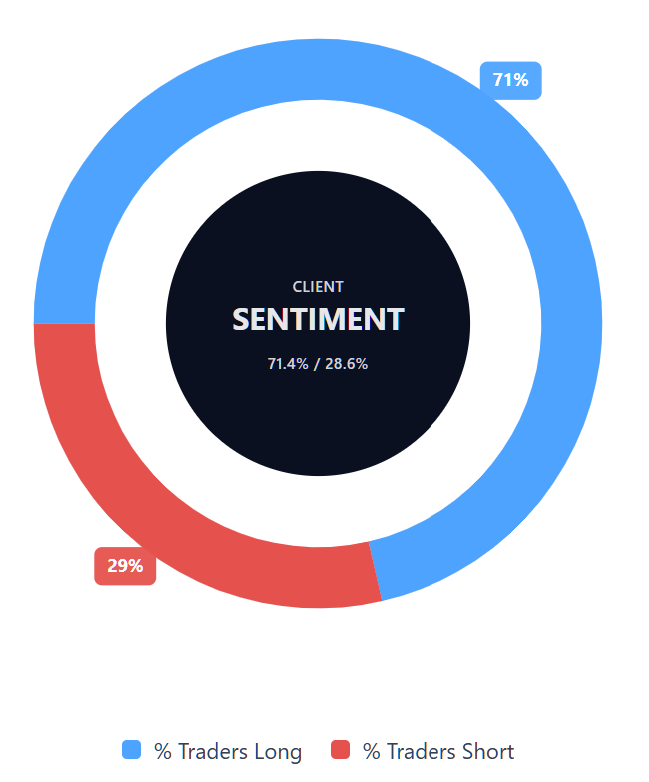
Capital.com’s client sentiment for US500 CFDs
As of 8 June 2026, Capital.com client positioning in US500 CFDs shows 71.4% long vs 28.6% short, placing it in heavy-buy territory. This snapshot reflects open positions on Capital.com and can change.
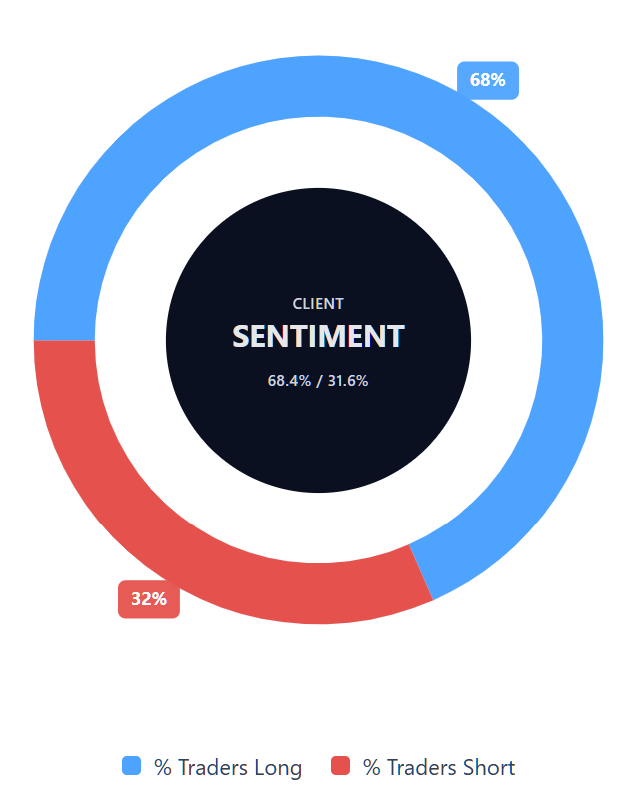
Capital.com’s client sentiment for US30 CFDs
As of 8 June 2026, Capital.com client positioning in US30 CFDs shows 68.4% long vs 31.6% short, keeping it in majority-buy territory but below extreme levels. This snapshot reflects open positions on Capital.com and can change.
Summary – US Tech 100, US 500, and US Wall Street 30 (2026)
- US Tech 100 trades at 29,585.70, US 500 at 7,453, and US Wall Street 30 at 51,044.30 as of 3:47pm UTC on 8 June 2026.
- AI-sector earnings momentum remains the main structural driver across all three indices, while elevated oil prices linked to Iran–Israel tensions add an inflationary overhang and margin risk.
- Geopolitical developments, the Federal Reserve’s policy path, and AI earnings delivery remain the key swing factors that could determine whether current support levels hold or come under renewed pressure.
Past performance is not a reliable indicator of future results.
FAQ
What is the US Tech 100, US 500, US Wall Street 30 price forecast?
Third-party forecasts published between late May and early June 2026 showed a broadly constructive but mixed outlook for major US indices. Reuters’ median year-end S&P 500 forecast stood at 7,620, while Goldman Sachs and UBS placed their targets higher at 8,000 and 7,900 respectively. For the US Tech 100, analysts highlighted AI-related earnings momentum as a key support, while also flagging policy, valuation and geopolitical risks.
Could US Tech 100, US 500, US Wall Street 30’s price go up or down?
Yes. US Tech 100, US 500 and US Wall Street 30 prices could move in either direction, depending on earnings, interest-rate expectations, inflation, oil prices and geopolitical developments. AI-related earnings growth may support valuations, particularly in technology-heavy indices, while elevated oil prices, a restrictive Federal Reserve stance or weaker corporate guidance could weigh on sentiment. Technical indicators also suggest that key support and resistance levels may shape near-term price action.
Should I invest in US Tech 100, US 500, US Wall Street 30?
Whether these indices are suitable for you depends on your financial goals, risk tolerance and understanding of the markets. This article is for informational purposes only and doesn’t constitute financial advice or a recommendation to buy, sell or hold any instrument. Index prices can be volatile, and CFD trading uses leverage, which can magnify both profits and losses. Always do your own research and consider seeking independent financial advice.
Can I trade US Tech 100, US 500 and US Wall Street 30 CFDs on Capital.com?
Yes, you can trade US100 CFDs, US500 CFDs and US30 CFDs on Capital.com. Trading commodity CFDs lets you speculate on price movements without owning the underlying asset and to take long or short positions. However, contracts for difference (CFDs) are traded on margin, and leverage amplifies both profits and losses. You should ensure you understand how CFD trading works, assess your risk tolerance, and recognise that losses can occur quickly.