TRON price prediction: Third-party outlook
TRON (TRX) is a cryptocurrency that runs on the TRON blockchain, a decentralised network focused on digital content distribution and blockchain-based applications. Explore third-party TRX price targets and technical analysis.
TRON (TRX) is trading around $0.29 against the US dollar, with Capital.com pricing showing an intraday range between a low of $0.28857 and a high of $0.29514 as of 12:13pm UTC on 30 January 2026. Past performance is not a reliable indicator of future results.
Price action comes amid broader crypto market volatility, as major digital assets have experienced elevated price swings, with Bitcoin trading through a period of heightened intraday movement and ETF outflows. Altcoins have generally amplified these fluctuations (Binance, 8 January 2026). TRX-specific flows have also drawn attention following reports that Tron-related entities added approximately 170,000 TRX around the $0.29 level, contributing to already sizeable treasury balances (Cryptonews.net, 28 January 2026). Network metrics and stablecoin activity on the TRON blockchain remain a focus for market participants, with third-party data providers pointing to consistently high on-chain transfer volumes and substantial stablecoin circulation on the network (Benzinga, 7 January 2026).
TRON price prediction 2026-2030: Analyst price target view
As of 30 January 2026, third-party TRX price predictions present a wide range of indicative targets for 2026, based on differing assumptions around broader crypto market conditions, regulatory developments and network adoption. These projections represent external, model-driven opinions and do not reflect Capital.com’s own view or expectations of future performance.
CryptoPredictions.com (quant model provider)
CryptoPredictions.com says TRON is projected to start February 2026 around $0.28 and end the month near $0.37, with an intra-month maximum forecast of $0.47 and a minimum of $0.32. The service notes that these ranges are derived from historical volatility patterns and algorithmic extrapolation of past TRX price data, rather than discretionary analyst judgement (CryptoPredictions.com, 30 January 2026).
CoinGape (crypto media)
CoinGape outlines potential 2026 price paths using minimum, average and higher-range scenarios generated by its in-house models. The analysis links these projections to chart-based trend studies and assumptions about how TRON’s on-chain activity and broader crypto risk appetite could evolve under changing macro conditions (CoinGape, 28 January 2026).
AMBCrypto (technical analysis commentary)
AMBCrypto reports that TRON’s price behaviour around the $0.30 area may indicate scope for a move towards the $0.37 region, based on its interpretation of evolving chart structure and momentum indicators. The commentary frames this within a broader retracement phase that could transition into renewed buying interest, depending on market conditions (AMBCrypto, 23 January 2026).
Predictions and third-party forecasts are inherently uncertain, as they cannot fully account for unexpected market developments. Past performance is not a reliable indicator of future results.
TRX price: Technical overview
The TRX price is trading around $0.2904 as of 12:13pm UTC on 30 January 2026, with price remaining below its short-term moving-average band on the daily chart. The 20-, 50-, 100- and 200-day SMAs cluster around approximately 0.3019, 0.2920, 0.2900 and 0.3125 respectively, leaving a spot marginally beneath the immediate trend gauge while still close to the medium-term centre line. RSI (14) near 41 sits in the lower-neutral zone, while an ADX (14) reading around 18 suggests the trend lacks strong directional momentum at present.
On the topside, the first area to monitor is the classic R1 pivot near 0.2929. A sustained daily close above this level would bring the R2 zone around 0.3017 back into focus as the next resistance area. The 10- and 20-day SMAs near 0.2961 and 0.3019 also form an overhead layer that could limit initial rebounds while price trades below this short-term cluster. The 10-day EMA, at roughly 0.2961, aligns closely with the 10-day SMA, keeping the simple moving-average band as the main near-term reference.
On pullbacks, the classic pivot point around 0.2819 marks initial support on the daily setup, with the 100-day SMA close to 0.2900 acting as the first moving-average support just beneath spot. A decisive move below that region would shift attention towards the S1 area near 0.2731, aligning with a deeper retracement towards the recent pivot zone. With MACD still marginally negative and several oscillators holding neutral readings, the broader technical picture continues to point to consolidation rather than a firmly established trend (TradingView, 30 January 2026).
This technical analysis is provided for informational purposes only and does not constitute financial advice or a recommendation to buy or sell any instrument.
TRON price history (2024–2026)
TRX/USD moved steadily higher through much of 2024, rising from the low-teens in US cents before accelerating late in the year and briefly trading above $0.40 in early December. Prices later retraced, with TRX closing 2024 closer to the mid-$0.20 range amid profit-taking and wider market volatility.
In 2025, price action followed a more uneven upward path. TRX traded in the low-to-mid-$0.20s in early spring, then pushed into the high-$0.20s and low-$0.30s during the summer as trading activity and risk appetite increased. By October, prices were frequently closing between $0.32 and $0.35, before easing back towards $0.28–$0.29 into year-end.
During the opening weeks of 2026, TRX has largely consolidated these earlier gains. From 1 to 30 January, daily prices mostly ranged between around $0.28 and $0.32, with brief moves above $0.31 followed by pullbacks. On 30 January 2026, TRX closed near $0.29, remaining well above levels seen in early 2024.
Past performance is not a reliable indicator of future results. Share prices are indicative and may differ from live market prices.
Capital.com analyst view: TRON
TRON’s TRX token has spent the past two years moving from a low-teens-cent range into the high-$0.20s, with notable rallies and retracements as broader crypto sentiment has shifted. The current consolidation around $0.29 as of 30 January 2026 sits well above early-2024 levels, reflecting periods where risk appetite, on-chain activity and speculative interest have coincided, alongside phases where prices have pulled back as conditions changed. Past performance is not a reliable indicator of future results.
Looking ahead, several factors could influence TRX in either direction. Increased usage of the TRON network, shifts in stablecoin flows and periods of improved sentiment towards higher-beta crypto assets could align with higher trading ranges. However, these dynamics can reverse, particularly if regulatory developments, security concerns or broader macroeconomic shocks weigh on risk appetite.
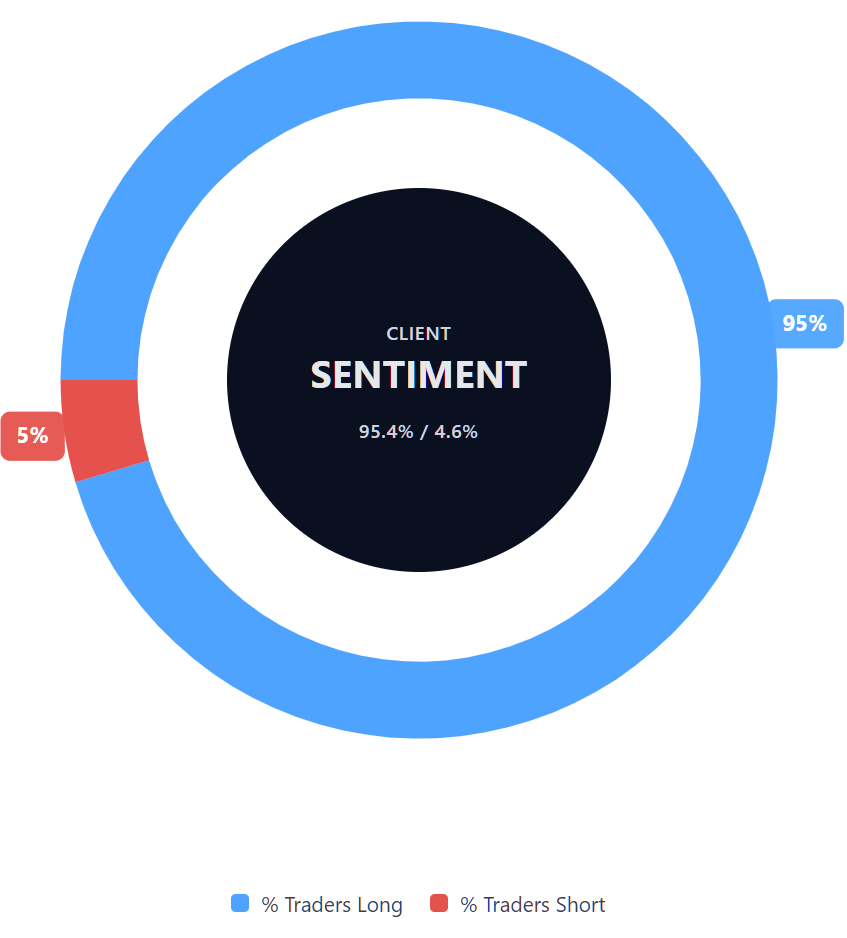
Capital.com’s client sentiment for TRON CFDs
As of 30 January 2026, Capital.com client positioning in TRON CFDs is currently skewed towards long positions, with 95.4% of buyers versus 4.6% of sellers. This places buyers ahead by approximately 90.7 percentage points, indicating that most open TRX CFD positions on the platform are positioned to the upside, while a small minority are positioned short. This snapshot reflects open positions at a specific point in time and may change as market conditions evolve.
Summary – TRON (2026)
- TRON (TRX/USD) is quoted around $0.2904 as of 12:13pm UTC on 30 January 2026, after trading between approximately $0.2886 and $0.2951 during the session.
- Over the past two years, TRX has risen from the low-$0.10 area in early 2024 to trade mostly within a $0.20–$0.35 range through 2025, including a brief spike above $0.40 in December 2024 before retracing.
- During 2025, prices generally trended higher, moving from the mid-$0.20s early in the year towards the low-$0.30s by mid-year and into the $0.32–$0.35 area in October, before easing back into the high-$0.20s by year-end.
- Current technical signals show TRX trading just below its short-term moving-average cluster, with RSI (14) around 41 in lower-neutral territory and ADX (14) near 18, consistent with a consolidative market environment rather than a strongly directional trend.
Past performance is not a reliable indicator of future results.
FAQ
What is the latest TRON crypto price prediction?
There is no single, definitive price prediction for TRON. Third-party forecasts published in late 2025 and early 2026 outline a wide range of indicative scenarios for TRX, often spanning from around $0.30 to higher levels under more optimistic assumptions. These projections are typically based on technical models, historical price behaviour and broader crypto market conditions. Such forecasts are illustrative rather than definitive and can change quickly as sentiment, liquidity and external events evolve.
Who owns the most TRON?
TRON ownership is spread across a large number of wallets, although blockchain data indicates that a relatively small group of large holders, often referred to as ‘whales’, control a significant share of circulating TRX. These include exchange wallets, network-related entities and long-term holders. While public blockchain data offers visibility on wallet balances, it does not always reveal the identity or intent behind specific holdings, and concentrations can change over time.
How many TRONs are there?
TRON has a large token supply, with billions of TRX currently in circulation. Unlike some cryptocurrencies with fixed supply limits, TRON operates a model that includes mechanisms such as token burning, which can reduce the circulating amount over time. Both total and circulating supply figures may change as network activity develops, making it important to refer to current blockchain data rather than static supply estimates.
Could TRON’s price go up or down?
TRON’s price can move in either direction and is influenced by a range of factors. These include broader crypto market sentiment, Bitcoin price movements, regulatory developments, changes in network usage and shifts in liquidity. Technical levels and trader positioning can also affect short-term price behaviour. As with other cryptocurrencies, TRX can experience periods of heightened volatility, and past price action does not provide certainty about future movements.
Should I invest in TRON?
Whether TRON is suitable depends on an individual’s financial circumstances, risk tolerance and understanding of the market. Cryptocurrencies are volatile, and prices can react sharply to news or changes in sentiment. This article does not provide investment advice. Anyone considering exposure to TRX may wish to carry out their own research, assess the risks involved and, where appropriate, seek independent financial advice before making a decision.
Can I trade TRON CFDs on Capital.com?
Trading TRON CFDs on Capital.com lets you speculate on price movements without owning the underlying asset and to take long or short positions. However, contracts for difference (CFDs) are traded on margin, and leverage amplifies both profits and losses. You should ensure you understand how CFD trading works, assess your risk tolerance, and recognise that losses can occur quickly.