
Stellantis stock forecast: Third-party price targets
Stellantis is reviewing the future of its Brampton, Ontario plant, with Unifor saying closure or sale is under consideration amid US tariff pressures. Explore third-party STLAM price targets and technical analysis. Past performance is not a reliable indicator of future results.
Stellantis N.V. (STLAM) is trading at $4.54 at 10:20am UTC on 27 August 2026, matching the session high within a $4.41–$4.54 intraday range. Past performance is not a reliable indicator of future results.
Recent company news includes Unifor saying Stellantis is considering the sale of its Brampton, Ontario plant. Its current labour agreement with Stellantis expires on 20 September. Stellantis had previously paused retooling at Brampton and moved planned Jeep Compass production to Illinois after US tariffs were imposed on Canadian goods (Reuters, 14 August 2026).
Stellantis stock forecast: tariffs and North America in focus
As of 27 August 2026, third-party Stellantis stock predictions set forward price targets for the company’s European-listed shares in euros. Ratings range from Underperform to Buy, with profitability, North American execution, inventories and cost control recurring across the underlying assumptions.
Bernstein (Underperform target)
Bernstein sets a €4 price target for Stellantis, down from €6.20, and moves its rating to Underperform from Market Perform. The firm flags scope for further risks to market expectations, with margins and profitability central to its forward assumptions (Investing.com, 7 August 2026).
RBC Capital Markets (Sector Perform target)
RBC Capital Markets sets a €5 price target, down from €7, while maintaining a Sector Perform rating. The bank expects Stellantis’s improvement plan to take time, with cost reduction, quality improvements and a recovery in North America among the assumptions underpinning its outlook (Boursorama, 12 August 2026).
Goldman Sachs (Neutral target)
Goldman Sachs sets a €5 Stellantis price target, down from €6, and maintains a Neutral rating. The bank identifies North America as a key factor in its outlook, with inventory management, market-share gains and execution on quality and manufacturing initiatives among its assumptions (finanzen.net, 14 August 2026).
Citi (Neutral target)
Citi sets a €5 price target for Stellantis, down from €5.50, while maintaining a Neutral rating. The update leaves the rating unchanged while lowering Citi’s valuation marker for the shares (TipRanks, 17 August 2026).
AlphaValue/Baader Europe (Buy target)
AlphaValue/Baader Europe sets a €6.27 price target for Stellantis, down from €6.33, while upgrading the shares to Buy from Add. The revision combines a higher rating with a slightly lower forward price target (Webull/MT Newswires, 13 August 2026).
Predictions and third-party forecasts are inherently uncertain, as they cannot fully account for unexpected market developments. Past performance is not a reliable indicator of future results.
Stellantis latest earnings and next results date
Stellantis reported second-quarter 2026 results on 30 July, with net revenue of €43.5bn, up 13% year on year. North American revenue rose 32% and South America increased 6%, while Enlarged Europe was flat and the Middle East and Africa and Asia Pacific recorded slight declines. Net profit reached €0.3bn, compared with a €1.9bn loss in Q2 2025. Adjusted operating income was €0.8bn, giving an adjusted operating margin of 1.8%, up 120 basis points year on year.
Industrial free cash flow was €1bn in Q2, around €1bn higher than a year earlier. Stellantis also reaffirmed its 2026 financial guidance, calling for a mid-single-digit percentage increase in net revenue, a low-single-digit adjusted operating income margin and improved industrial free cash flow year on year. The company estimated a net tariff headwind of €1bn–€1.2bn for 2026, with €0.3bn of net tariff costs recorded in the first half after a €0.4bn tariff refund (Stellantis, 30 July 2026).
Stellantis is scheduled to report third-quarter 2026 financial results on 28 October 2026, according to its published investor calendar (Stellantis, 13 January 2026).
STLAM stock price: technical overview
The STLAM stock price trades at $4.54 as of 10:20am UTC on 27 August 2026, at the upper end of the supplied $4.41–$4.54 intraday range. The daily simple moving-average cluster sits at about $4.7 / $4.9 / $5.7 / $6.8 across the 20/50/100/200-day periods, leaving the price below all four averages.
The 14-day relative strength index stands at 42.02, below the neutral midpoint of 50 without reaching a conventional oversold threshold. The supplied momentum readings are also negative, including the MACD level at -0.1589, while the Hull moving average sits nearer the current price at $4.47.
The nearest supplied classic pivot above the current price is S1 at $4.59, followed by the central pivot at $4.96. A daily close above that area would bring R1 near $5.34 into view, while the 50-day simple moving average around $4.91 provides another overhead reference.
On the downside, the nearest lower classic pivot is S2 at $4.22. The longer-term 100- and 200-day simple moving averages, near $5.72 and $6.81, remain above the current price and therefore do not provide lower support references (TradingView, 27 August 2026).
This is technical analysis for informational purposes only and does not constitute financial advice or a recommendation to buy or sell any instrument.
Stellantis share price history (2024–2026)
STLAM’s stock price closed at $15.03 on 28 August 2024, before falling to $12.44 by 30 September. The decline coincided with Stellantis cutting its 2024 guidance as it expanded measures to address North American performance issues and weaker global industry conditions (Stellantis, 30 September 2024).
The stock began 2025 at $12.64 and reached $13.78 in February, before dropping through the spring and closing at $7.80 on 31 July. First-half results later reflected €3.3bn of pre-tax charges and €0.3bn of net US tariff costs, alongside lower shipments and ongoing turnaround measures (Stellantis, 21 July 2025). Stellantis ended 2025 at $9.49.
Volatility continued in 2026. The shares fell from $8.21 on 5 February to $6.23 on 6 February as Stellantis announced around €22.2bn of second-half 2025 charges linked to a strategic reset (Stellantis, 6 February 2026). The price later reached $7.46 on 17 April before falling back. At 10:20am UTC on 27 August 2026, Stellantis traded at $4.54, about 69.8% below its 28 August 2024 close. This came despite Q2 results showing higher revenue and a return to net profit year on year.
Past performance is not a reliable indicator of future results. Share prices are indicative and may differ from live market prices.
Stellantis (STLAM): Capital.com analyst view
Stellantis shares have traded lower in 2026, with STLAM at $4.54 at 10:20am UTC on 27 August. The latest operating picture is more mixed. Second-quarter net revenue rose 13% year on year to €43.5bn, with North American revenue up 32%, while net profit reached €0.3bn and the adjusted operating margin improved to 1.8%. Further progress in volumes, margins or North American execution could support sentiment. However, continued weakness in Enlarged Europe, which remained loss-making on an adjusted operating basis, could work in the opposite direction (Stellantis, 30 July 2026).
Trade policy remains another variable. Stellantis estimates a €1bn–€1.2bn net tariff headwind for 2026, while reaffirming guidance for mid-single-digit revenue growth and a low-single-digit adjusted operating margin. Lower tariff costs or stronger execution could support earnings, while persistent trade friction, weaker pricing or slower cost reductions could weigh in the other direction. Reports that Stellantis is considering the sale of its Brampton plant also keep North American manufacturing decisions in focus (Reuters, 14 August 2026).
Capital.com’s client sentiment for Stellantis CFDs
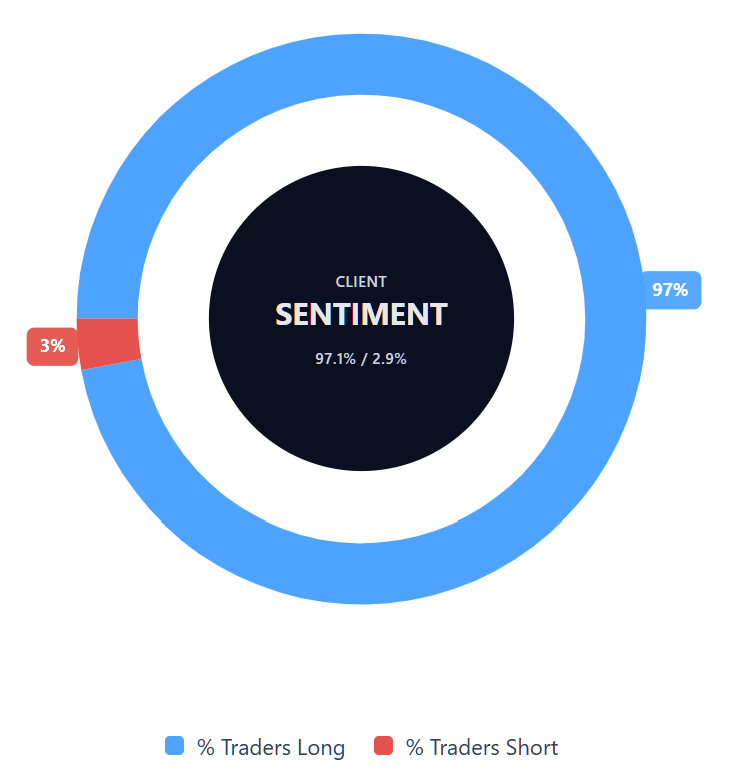
As of 27 August 2026, Capital.com client positioning in Stellantis CFDs is 97.1% buyers versus 2.9% sellers, putting buyers ahead by 94.2 percentage points and meaning buyer positions represent the majority of this snapshot. This snapshot reflects open positions on Capital.com and can change.
Summary – Stellantis 2026
- Stellantis trades at $4.54, versus $15.03 on 28 August 2024, after a two-year period marked by a broad decline and intermittent volatility.
- According to TradingView data, technical indicators show the price below its 20/50/100/200-day simple moving averages, while the 14-day relative strength index stands at 42.02.
- Key price drivers include North American execution, margins, inventories, tariff costs, pricing and the pace of Stellantis’s wider cost-reduction programme.
- Recent attention centres on higher second-quarter revenue, a return to net profit, tariff headwinds and reports that Stellantis is considering selling its Brampton plant.
Past performance is not a reliable indicator of future results.
FAQ
What is the five-year Stellantis share price forecast?
The article does not provide a five-year Stellantis share price forecast. The analyst updates captured in August 2026 set shorter-term targets for the European-listed shares, ranging from €4 to €6.27. Extending those targets across five years would add assumptions the cited analysts did not make. Longer-term prices could depend on profitability, North American execution, tariffs, inventories, pricing and wider automotive demand, all of which can change materially over time.
Is Stellantis a good stock to buy?
Whether Stellantis is a 'good' stock to buy cannot be determined from a single metric or forecast. Second-quarter 2026 revenue and net profit improved year on year, while North American revenue also rose. However, Enlarged Europe remained loss-making on an adjusted operating basis, and Stellantis estimated a €1bn–€1.2bn net tariff headwind for 2026. Those factors create both potential support and downside risks, rather than a clear investment conclusion.
Could Stellantis stock go up or down?
Yes. Stellantis shares can move in either direction as company and market conditions change. Higher revenue, improving margins, lower tariff costs or stronger North American execution could support the price. Weaker pricing, persistent tariff costs, elevated inventories or continued losses in Enlarged Europe could weigh in the other direction. Broader factors such as interest rates, consumer demand and trade policy may also affect automotive stocks, sometimes offsetting company-specific developments.
Should I invest in Stellantis stock?
Whether to invest in Stellantis depends on individual objectives, time horizon and tolerance for risk, so this page does not provide a personal recommendation. The company’s recent results show some improvement in revenue and profitability, but the share price has also fallen substantially over the two-year period covered here. Relevant considerations include execution in North America, European profitability, tariffs, inventories and pricing, alongside the possibility that these factors develop differently from current expectations.
Can I trade Stellantis CFDs on Capital.com?
Yes, you can trade Stellantis CFDs on Capital.com. Trading share CFDs lets you speculate on price movements without owning the underlying asset and to take long or short positions. However, contracts for difference (CFDs) are traded on margin, and leverage amplifies both profits and losses. You should ensure you understand how CFD trading works, assess your risk tolerance, and recognise that losses can occur quickly.