SPDR S&P 500 ETF forecast: Fed pause, oil risks
SPY is the largest ETF tracking the S&P 500, with its price shaped by U.S. rate expectations, inflation data and broader moves in energy markets and investor sentiment. Past performance is not a reliable indicator of future results. Explore third-party SPY price targets and technical analysis.
SPDR S&P 500 ETF (SPY) is trading at $659.99 in early European trading at 9:17am UTC on 19 March 2026, within an intraday range of $659.24–$674.38. Past performance is not a reliable indicator of future results.
Sentiment across U.S. equities remains under pressure after the Federal Reserve held interest rates steady while revising its inflation outlook higher, with Chair Jerome Powell citing rising energy costs as a near-term upside risk to inflation (Kiplinger, 18 March 2026). Crude oil prices continue to weigh on risk appetite, as Brent crude futures approached $113 per barrel on Thursday amid fresh attacks on Middle East energy infrastructure and ongoing disruption to Strait of Hormuz shipping lanes, which have remained restricted for nearly three weeks (Al Jazeera, 16 March 2026). The February U.S. Producer Price Index also came in above expectations, adding to concerns that core inflation, which reached 3.1% year over year in January per the Bureau of Economic Analysis, remains well above the Fed's 2% target (Reuters, 18 March 2026).
SPDR S&P 500 ETF forecast 2026–2030: Third-party price targets
As stated by the sources below, as of 19 March 2026, third-party SPDR S&P 500 ETF predictions reflect a wide range of year-end 2026 projections, shaped by earnings growth expectations, Federal Reserve policy, oil price dynamics, and geopolitical risk.
Wallet Investor (algorithmic 12-month model)
Wallet Investor projects SPY to close March 2026 at $701.03, within a monthly range of $695.18–$701.03, rising to $768.03 by December 2026, which would imply a gain of approximately 14% from the 18 March 2026 quote of $679.06. The model extrapolates prevailing trend momentum on a month-on-month basis, with June 2026 priced at $724.26 and October 2026 at $750.59, and carries no fundamental macro assumptions (Wallet Investor, 18 March 2026).
Goldman Sachs (house view reiteration)
Goldman Sachs reiterates its base-case year-end 2026 target for the S&P 500 at 7,600, equivalent to approximately 13.5% above the 17 March 2026 level of 6,697.99, and projects S&P 500 earnings per share at $309 for 2026 and $342 for 2027, implying growth of roughly 12% and 10% respectively. The bank cites continued earnings expansion and steady economic growth as the primary supports, while also outlining a bear-case scenario in which the index falls to 5,400 if oil shocks and geopolitical escalation trigger a significant inflation spike (TheStreet, 17 March 2026).
MarketBeat (S&P 500 performance update)
MarketBeat notes that the S&P 500 is down approximately 2.2% year to date from its 2025 year-end close of 6,845.50, with the index trading near 6,697.99, as elevated oil prices, stickier inflation, and delayed Federal Reserve rate-cut expectations have offset early-year momentum. The report also notes that market leadership remains concentrated in mega-cap technology names, with the top 10 constituents accounting for approximately 39% of the index's total market capitalisation (MarketBeat, 16 March 2026).
Tickeron (technical signal model)
Tickeron flags that SPY crossed bearishly below its 50-day moving average on 27 February 2026, confirming a shift from an upward to a downward short-term trend, while a subsequent Aroon Indicator downtrend signal appeared on 17 March 2026. The platform's pattern-recognition model notes that, in 14 comparable historical instances where the 10-day moving average crossed below the 50-day, SPY continued lower in the following month, with the model citing weakening breadth and elevated valuations as the prevailing technical headwinds (Tickeron, 17 March 2026).
Predictions and third-party forecasts are inherently uncertain, as they cannot fully account for unexpected market developments. Past performance is not a reliable indicator of future results.
SPY price: Technical overview
On the daily chart, the SPY price trades at $659.99 as of 9:17am UTC on 19 March 2026, sitting just below its 20-, 50-, 100-, and 200-day SMAs at roughly $679, $685, $682, and $660 respectively. This configuration leaves price beneath the entire short-term and medium-term moving average stack, with only the 200-day SMA near $659.77 showing a buy signal according to TradingView’s moving-average data, rather than our interpretation of the indicator setup. The 20-over-50 alignment does not hold here, as price trades below all key SMAs, reinforcing the prevailing bearish structure across the moving average family. The Hull moving average (9) at $664.11 also points lower, consistent with the broader sell bias registered across 10 of the 13 moving averages in the dataset.
Momentum is soft: the 14-day RSI reads 36.26, a lower-neutral level that stops short of oversold territory but reflects diminished buying pressure; the ADX at 30.56 confirms that an established trend is in force, lending weight to the directional move lower rather than suggesting the decline is simply a drift. The MACD (12, 26) sits at −5.67 with a sell signal, and the momentum (10) reading of −23.70 echoes the same tone.
On the topside, the classic pivot at $686.30 is the first reference to reclaim; a daily close above that level would put the R1 level at $696.83 back in view, with R2 near $707.66 as the next meaningful area if buying interest continues.
On pullbacks, the classic pivot support (P) at $686.30 is already above current price, leaving the 200-day SMA near $659.77 as the immediate structural shelf. The S1 level at $675.47 sits between current price and the pivot and may act as an interim reference; losing the 200-day SMA shelf on a closing basis would leave a deeper move towards the S2 area near $664.94 and potentially the S3 zone around $643.58 in focus (TradingView, 19 March 2026).
This is technical analysis for informational purposes only and does not constitute financial advice or a recommendation to buy or sell any instrument.
SPDR S&P 500 ETF history (2024–2026)
SPY’s price opened March 2024 around $520, climbing steadily through the spring and summer to reach a peak close of $607.95 on 6 December 2024, its highest close in the dataset. The fund ended 2024 at $586.66, a gain of roughly 12.7% from its 20 March 2024 open near $520.
2025 brought sharper swings. SPY started the year near $584 and briefly touched $612.21 on 19 February 2025 before a broad sell-off took hold. By early April 2025, tariff-driven volatility had pushed the fund to an intraday low of $481.86 on 7 April, its lowest point in the two-year window, before a swift recovery carried it back above $595 by late May and above $690 by late January 2026.
SPY closed at $660.09 on 19 March 2026, approximately 3.5% down year to date from its 31 December 2025 close of $682.21, but around 16.1% above the same date one year prior ($568.84 on 19 March 2025).
Past performance is not a reliable indicator of future results. Share prices are indicative and may differ from live market prices.
SPDR S&P 500 ETF (SPY): Capital.com analyst view
SPY's performance since March 2024 reflects the breadth of forces shaping US equity markets. The fund climbed steadily through 2024, closing the year near $586.66, before extending higher into early 2025. That advance was sharply interrupted in April 2025, when the Trump administration's tariff announcements triggered a drawdown of roughly 18.9% from the February 2025 all-time high to an intraday low near $481 on 7 April. The subsequent recovery was swift but, as some analysts noted, disproportionately driven by a narrow group of large-cap technology names, raising questions about market breadth that remain relevant heading into 2026.
As of 19 March 2026, SPY trades near $659.99, approximately 3.5% below its end-2025 close, with the fund sitting beneath all major short- and medium-term moving averages. Persistent inflation pressures, a Federal Reserve holding rates at elevated levels, and renewed energy price rises are weighing on sentiment; equally, some strategists point to still-solid corporate earnings and AI-driven productivity gains as factors that could support the index if macro headwinds ease. These competing dynamics make the near-term picture genuinely uncertain, and outcomes in either direction remain plausible.
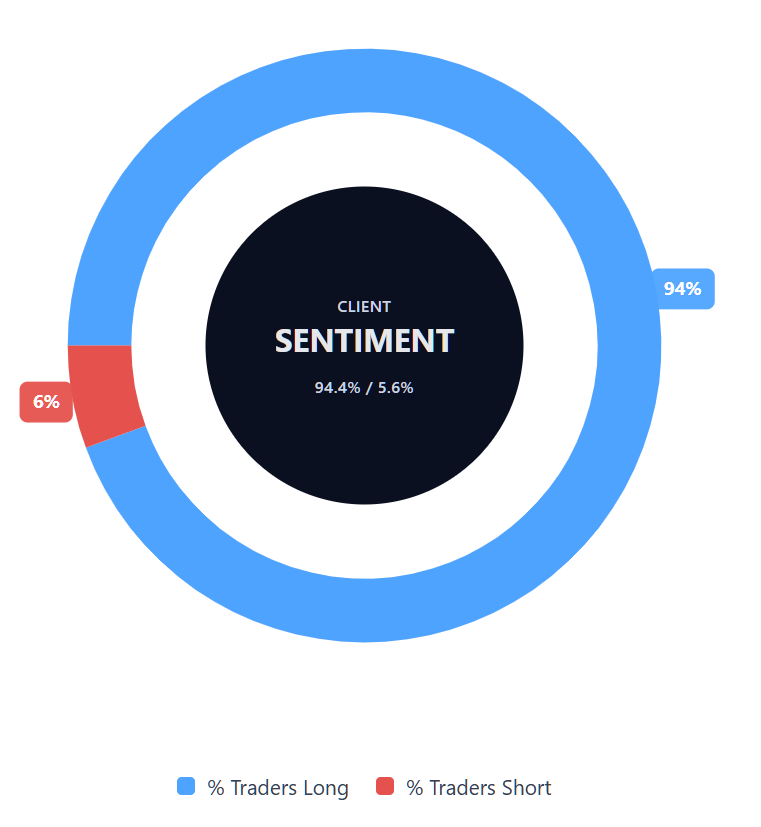
Capital.com’s client sentiment for SPDR S&P 500 ETF CFDs
As of 19 March 2026, Capital.com client positioning in SPDR S&P 500 ETF CFDs is skewed towards long positions, with 94.4% buyers and 5.6% sellers. This leaves buyers ahead by 89.0 percentage points and places sentiment firmly in heavy-buy, one-sided territory. This snapshot reflects open positions on Capital.com and can change.
Summary – SPDR S&P 500 ETF 2026
- SPY trades at $659.99 as of 9:17am UTC on 19 March 2026, around 3.5% below its end-2025 close of $682.21 and 16.1% above the same date one year prior.
- Technical indicators are broadly bearish: SPY trades below all major short- and medium-term moving averages, with the 14-day RSI at 36.26 and ADX at 30.56 confirming that an established downtrend is in force.
- Classic pivot support sits at $686.30, above current price; the 200-day SMA near $659.77 is the immediate structural shelf, with S3 around $643.58 acting as the next reference on a sustained break lower.
- Key drivers include the Federal Reserve holding rates while lifting its inflation outlook, rising oil prices near $113 per barrel, and above-forecast producer price data adding to inflation concerns.
Past performance is not a reliable indicator of future results.
FAQ
What is the 5 year SPDR S&P 500 ETF forecast?
The largest holders of the SPDR S&P 500 ETF (SPY) are typically institutional investors such as asset managers, pension funds, hedge funds and other investment firms. Because SPY is one of the biggest and most actively traded ETFs in the world, ownership is spread across a wide base rather than concentrated in one individual holder. Holdings can change over time as funds rebalance, so investors usually check the latest regulatory filings and fund data for updated ownership details.
Is the SPDR S&P 500 ETF a good buy?
A five-year SPDR S&P 500 ETF forecast is inherently uncertain because it depends on several moving parts, including earnings growth, interest rates, inflation, oil prices and broader geopolitical conditions. Over longer periods, forecasts become less precise and should be treated as scenarios rather than firm expectations. Analysts and models may point in different directions, so longer-term projections are best viewed as reference points that can help frame possible outcomes rather than predict a set future price.
Could the SPDR S&P 500 ETF go up or down?
Whether SPDR S&P 500 ETF is a good buy depends on an individual's goals, time horizon, risk tolerance and market view. SPY offers broad exposure to large-cap U.S. equities, which some market participants use to follow the overall direction of the S&P 500. At the same time, its price can fall as well as rise, especially when inflation, interest-rate expectations or geopolitical risks weigh on sentiment. That means suitability is personal rather than universal.
Yes, SPDR S&P 500 ETF can move in either direction, sometimes sharply, depending on macroeconomic data, central bank policy, corporate earnings and shifts in market sentiment. In the current context, analysts are weighing both supportive factors, such as earnings resilience, and downside risks, including persistent inflation and higher energy prices. Technical indicators can also influence near-term expectations, but they do not guarantee future moves. Any forecast should therefore allow room for both upside and downside scenarios.
Should I invest in the SPDR S&P 500 ETF?
Whether someone should invest in SPDR S&P 500 ETF is a personal decision rather than a general conclusion. SPY gives exposure to the S&P 500, but that does not remove market risk, concentration risk or the possibility of losses during periods of volatility. Before making any investment decision, traders and investors usually consider their objectives, financial situation and tolerance for risk. Market commentary and forecasts can inform research, but they should not be treated as personal financial advice.
Can I trade SPDR S&P 500 ETF CFDs on Capital.com?
Yes, you can trade SPDR S&P 500 ETF CFDs on Capital.com. Trading CFDs lets you speculate on price movements without owning the underlying asset and to take long or short positions. However, contracts for difference (CFDs) are traded on margin, and leverage amplifies both profits and losses. You should ensure you understand how CFD trading works, assess your risk tolerance, and recognise that losses can occur quickly.